Higher Yields, Historic Flows, Solid Credit
October 26, 2026
Read Time 8 MIN
Key Takeaways
- Yields are at multi-year highs. AAA munis yielded 4.58% at the end of September, the highest month-end level since October 2008. The climb came from a Fed rate hike and revived inflation fears, not credit.
- After taxes, munis beat taxable bonds. AAA munis yield 4.58%, which is worth 6.03% to an investor in the 24% bracket and 7.27% at 37%, against 5.56% for the U.S. Aggregate.
- Investors are choosing ETFs. In September, muni ETFs took in nearly $14 billion, a record, while open-end muni funds lost $11 billion, a roughly $25 billion gap in one month.
- Credit is holding up. Investment-grade munis have defaulted far less often than similarly rated corporates, with BBB munis at roughly one-third the corporate rate, and the extra yield on BBB munis over AAA is just 75 basis points, well below its long-run average.
Click here for standardized performance for the VanEck Muni ETFs
The performance data quoted represents past performance. Past performance is not a guarantee of future results. Investment return and principal value of an investment will fluctuate so that an investor's shares, when redeemed, may be worth more or less than their original cost. Performance may be lower or higher than performance data quoted. Please call 800.826.2333 or visit vaneck.com for performance current to the most recent month ended.
Yields are at multi-year highs
AAA yields rose from 3.47% at the end of June to 4.58% at the end of September, more than a full percentage point in one quarter. The worries began in July, when an escalation in the Iran war sent oil prices sharply higher and revived inflation fears. The Federal Reserve then delivered its first rate hike since 2023, a 25-basis-point increase on September 16, and the 10-year Treasury yield ended the quarter near 5.3%, up 85 basis points from June. Munis sold off more than every major fixed-income sector except long-term Treasuries as rising rates met heavy supply, and the Morningstar U.S. Municipal Bond Index fell 5.9%. The same selloff pushed yields on lower-rated BBB munis up to 5.33%. Because the move was driven by rates and inflation rather than defaults, investors buying today can clip higher coupons without reaching for weaker credit.
Chart 1 — AAA muni yields are the highest since 2008
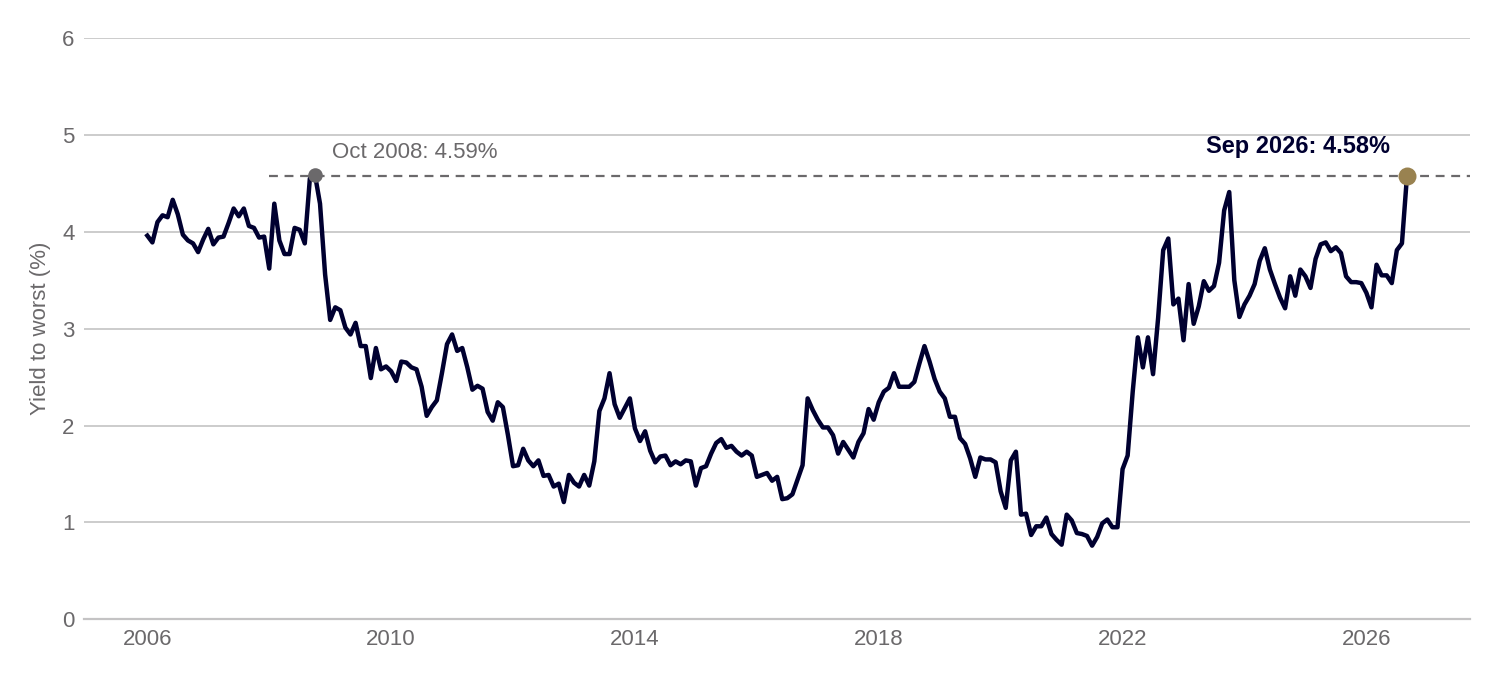
Source: ICE Data (ICE BofA AAA U.S. Municipal Securities Index, yield to worst, month-end, Jan 2006–Sep 2026).
Please see index and category definitions at the end of this content.
The long end of the muni curve still pays the most
The third-quarter selloff repriced the entire AAA muni curve. From June 30 to September 30, yields rose about 110 basis points from the two-year out to the 10-year, and by as much as 123 basis points around the 15- to 17-year mark. The longest bonds moved least: the 30-year rose 91 basis points, to 5.08%. That narrowed the gap between two- and 30-year yields to 161 basis points from 181, but the reward for extending is still large.
The long end also looks cheapest relative to Treasuries. The 30-year AAA muni yielded 92% of the 30-year Treasury at September 30, compared with 73% at five years. Longer bonds also carry more rate risk, as the quarter showed. The VanEck Long Muni ETF (MLN) tracks the long end of the investment-grade muni market, with a 30-day SEC yield of 4.81% (7.63% taxable-equivalent at the 37% bracket) at September 30. The VanEck High Yield Muni ETF (HYD) holds slightly shorter maturities than MLN but carries higher credit risk, with a 30-day SEC yield of 4.94% (7.84% taxable-equivalent at the 37% bracket) on September 30.
Chart 2 — AAA muni yields rose across the curve in Q3; the 30-year rose least
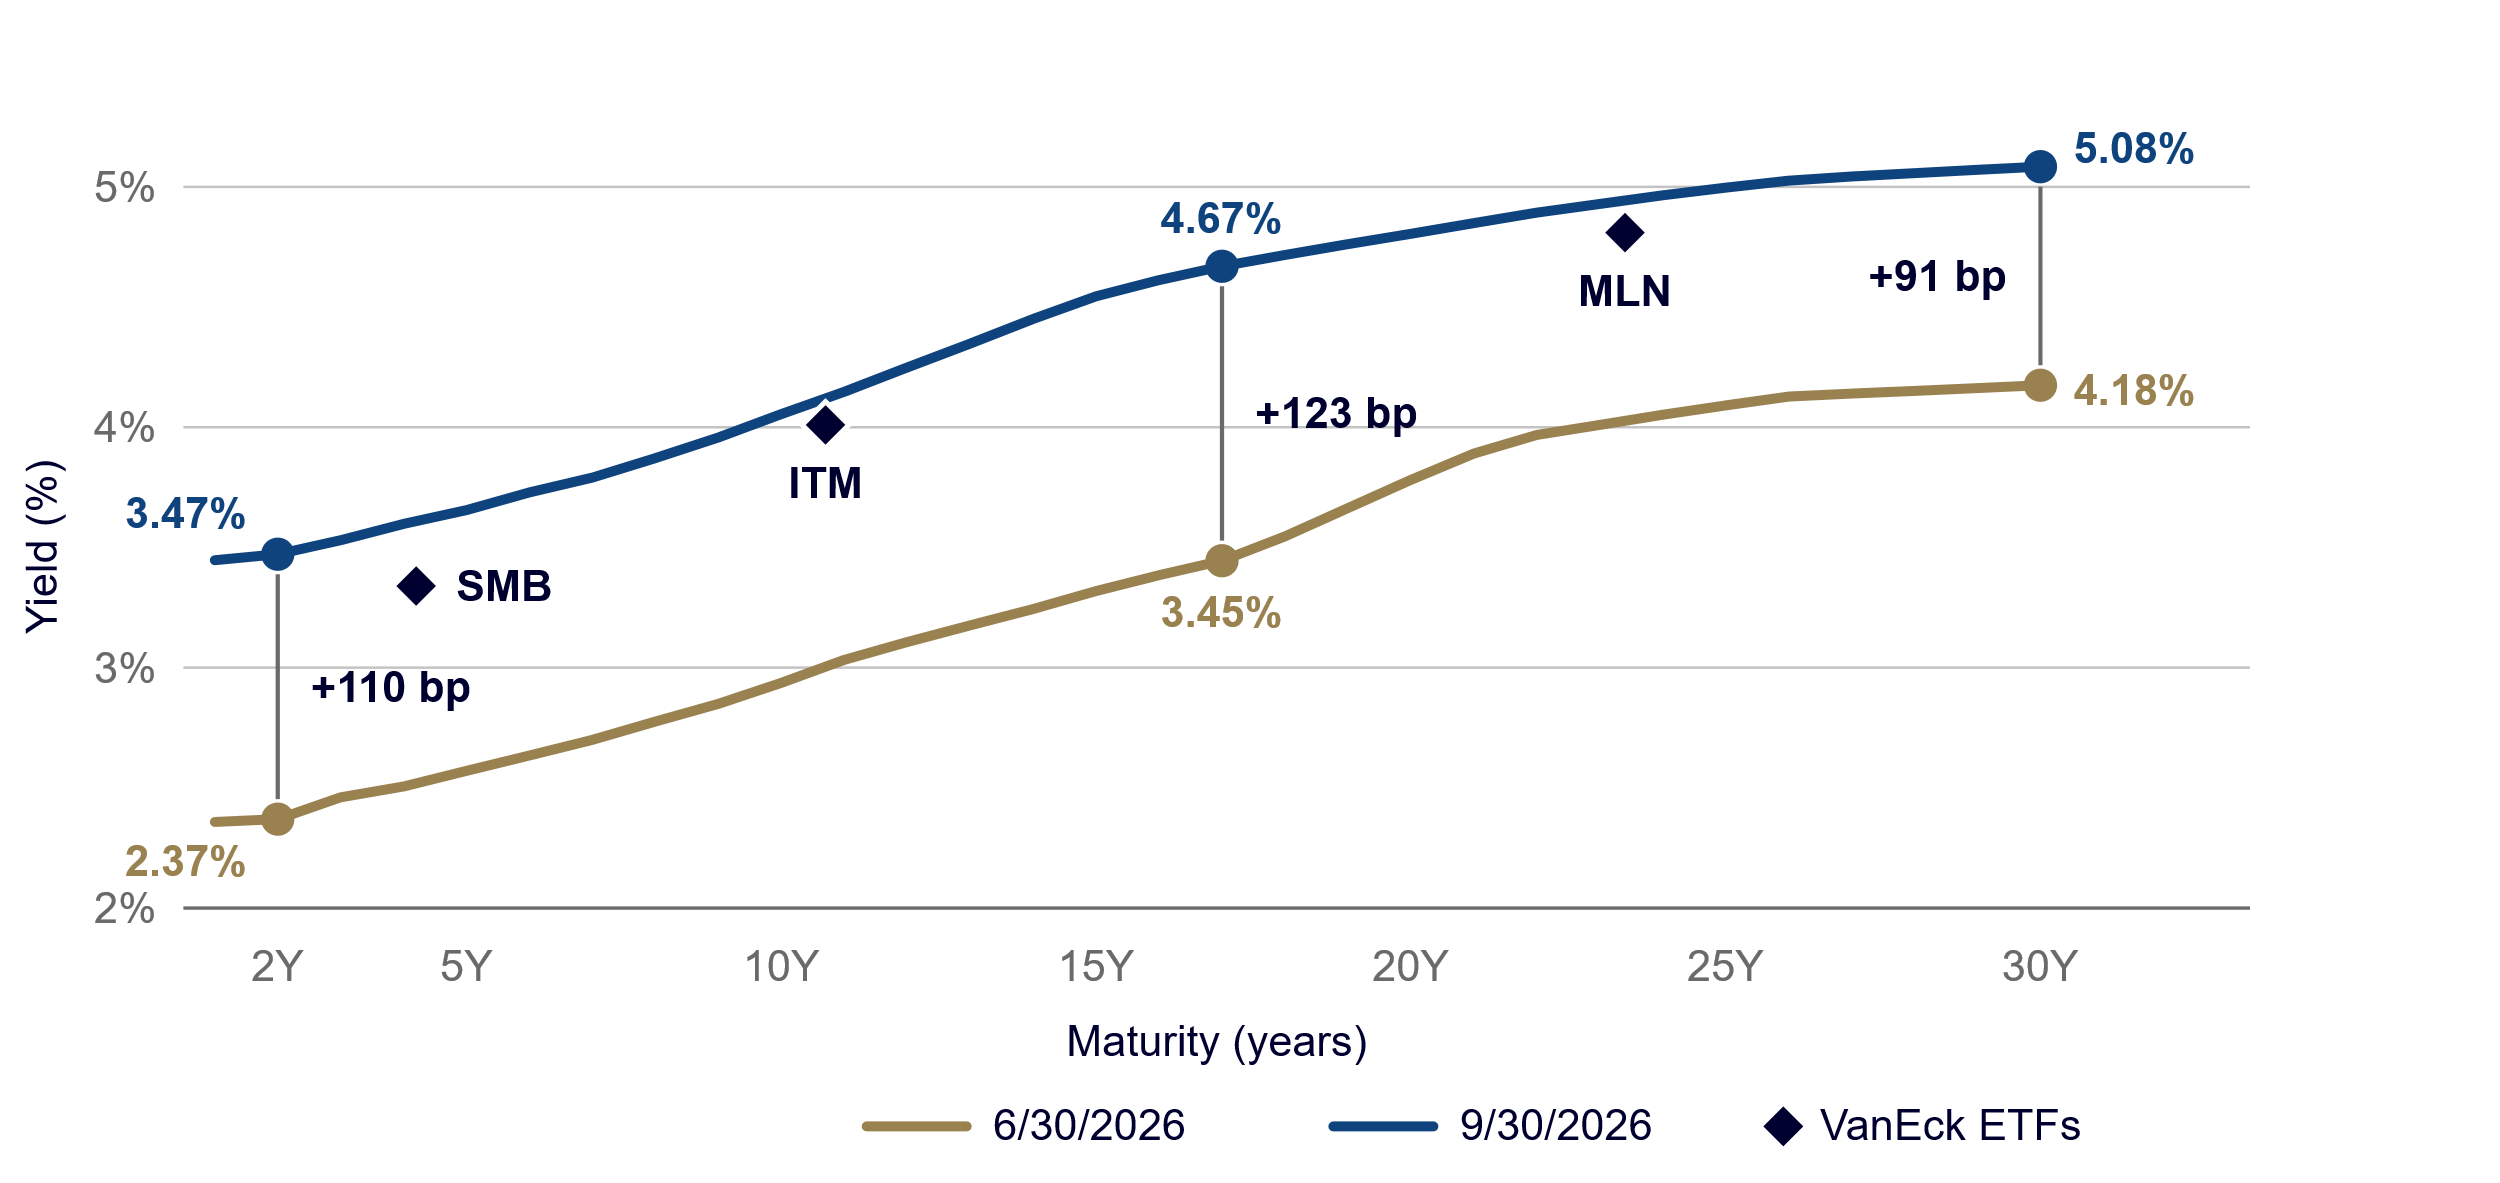
Source: ICE Data Services, AAA municipal yield curve, 6/30/2026 and 9/30/2026. VanEck ETFs are plotted at their 30-day SEC yields as of 9/30/2026 and approximate weighted-average years to maturity (VanEck, Schwab). Yield alone should not be the basis for an investment decision. See above for standardized performance.
Please see index and category definitions at the end of this content.
After taxes, munis beat taxable bonds
Before taxes, AAA munis yield 4.58%, against 5.56% for the U.S. Aggregate. After federal taxes, the picture flips. For an investor in the 24% bracket, a 4.58% tax-free yield is worth 6.03% from a taxable bond; in the top 37% bracket, it is worth 7.27%. The break-even tax rate is about 18%, so munis come out ahead for anyone in the 22% bracket or higher, before even counting state taxes. The Q3 selloff also made munis cheaper relative to Treasuries: Morningstar notes that the muni-to-Treasury ratio for maturities under three years widened to 75% from roughly 60%.
Table 1 — Taxable-equivalent yield of AAA munis vs. the U.S. Aggregate
| Yield (%) | Advantage vs. U.S. Aggregate (pct. pts.) | |
| U.S. Aggregate Bonds (taxable) | 5.56 | — |
| AAA Municipal Bonds (tax-exempt) | 4.58 | -0.98 |
| Taxable-equivalent, 22% bracket | 5.87 | +0.31 |
| Taxable-equivalent, 24% bracket | 6.03 | +0.47 |
| Taxable-equivalent, 32% bracket | 6.74 | +1.18 |
| Taxable-equivalent, 35% bracket | 7.05 | +1.49 |
| Taxable-equivalent, 37% bracket | 7.27 | +1.71 |
Source: ICE Data and J.P. Morgan Asset Management (Guide to the Markets – U.S.). U.S. Aggregate Bonds = Bloomberg U.S. Aggregate Bond Index; AAA Municipal Bonds = ICE BofA AAA U.S. Municipal Securities Index; yield to worst as of 9/30/2026. Taxable-equivalent yield = muni yield / (1 – federal tax rate); state, local and AMT not considered. Taxable-equivalent rows calculated from the AAA municipal yield. Please see index and category definitions at the end of this content.
Recommended subscription
Muni investors are choosing ETFs — a $25 billion gap in September
Investors are moving into ETFs, and September made that clear. Muni ETFs took in nearly $14 billion, the largest monthly total on record, while open-end muni funds lost $11 billion, their largest outflow since 2022. That is a roughly $25 billion gap in a single month, and it came after open-end funds had taken in money every month from October 2025 through August. Demand for munis overall has been strong too. Over the 12 months through June 2026, muni funds drew roughly $105 billion, a near-record pace according to Morningstar. Lower costs, tax efficiency and intraday trading are drawing advisors to the ETF structure. In addition, with many muni funds sitting on losses after the selloff, investors may be able to swap into cheaper ETFs without triggering meaningful capital gains.
Chart 3 — September: muni ETFs took in a record while open-end funds saw outflows
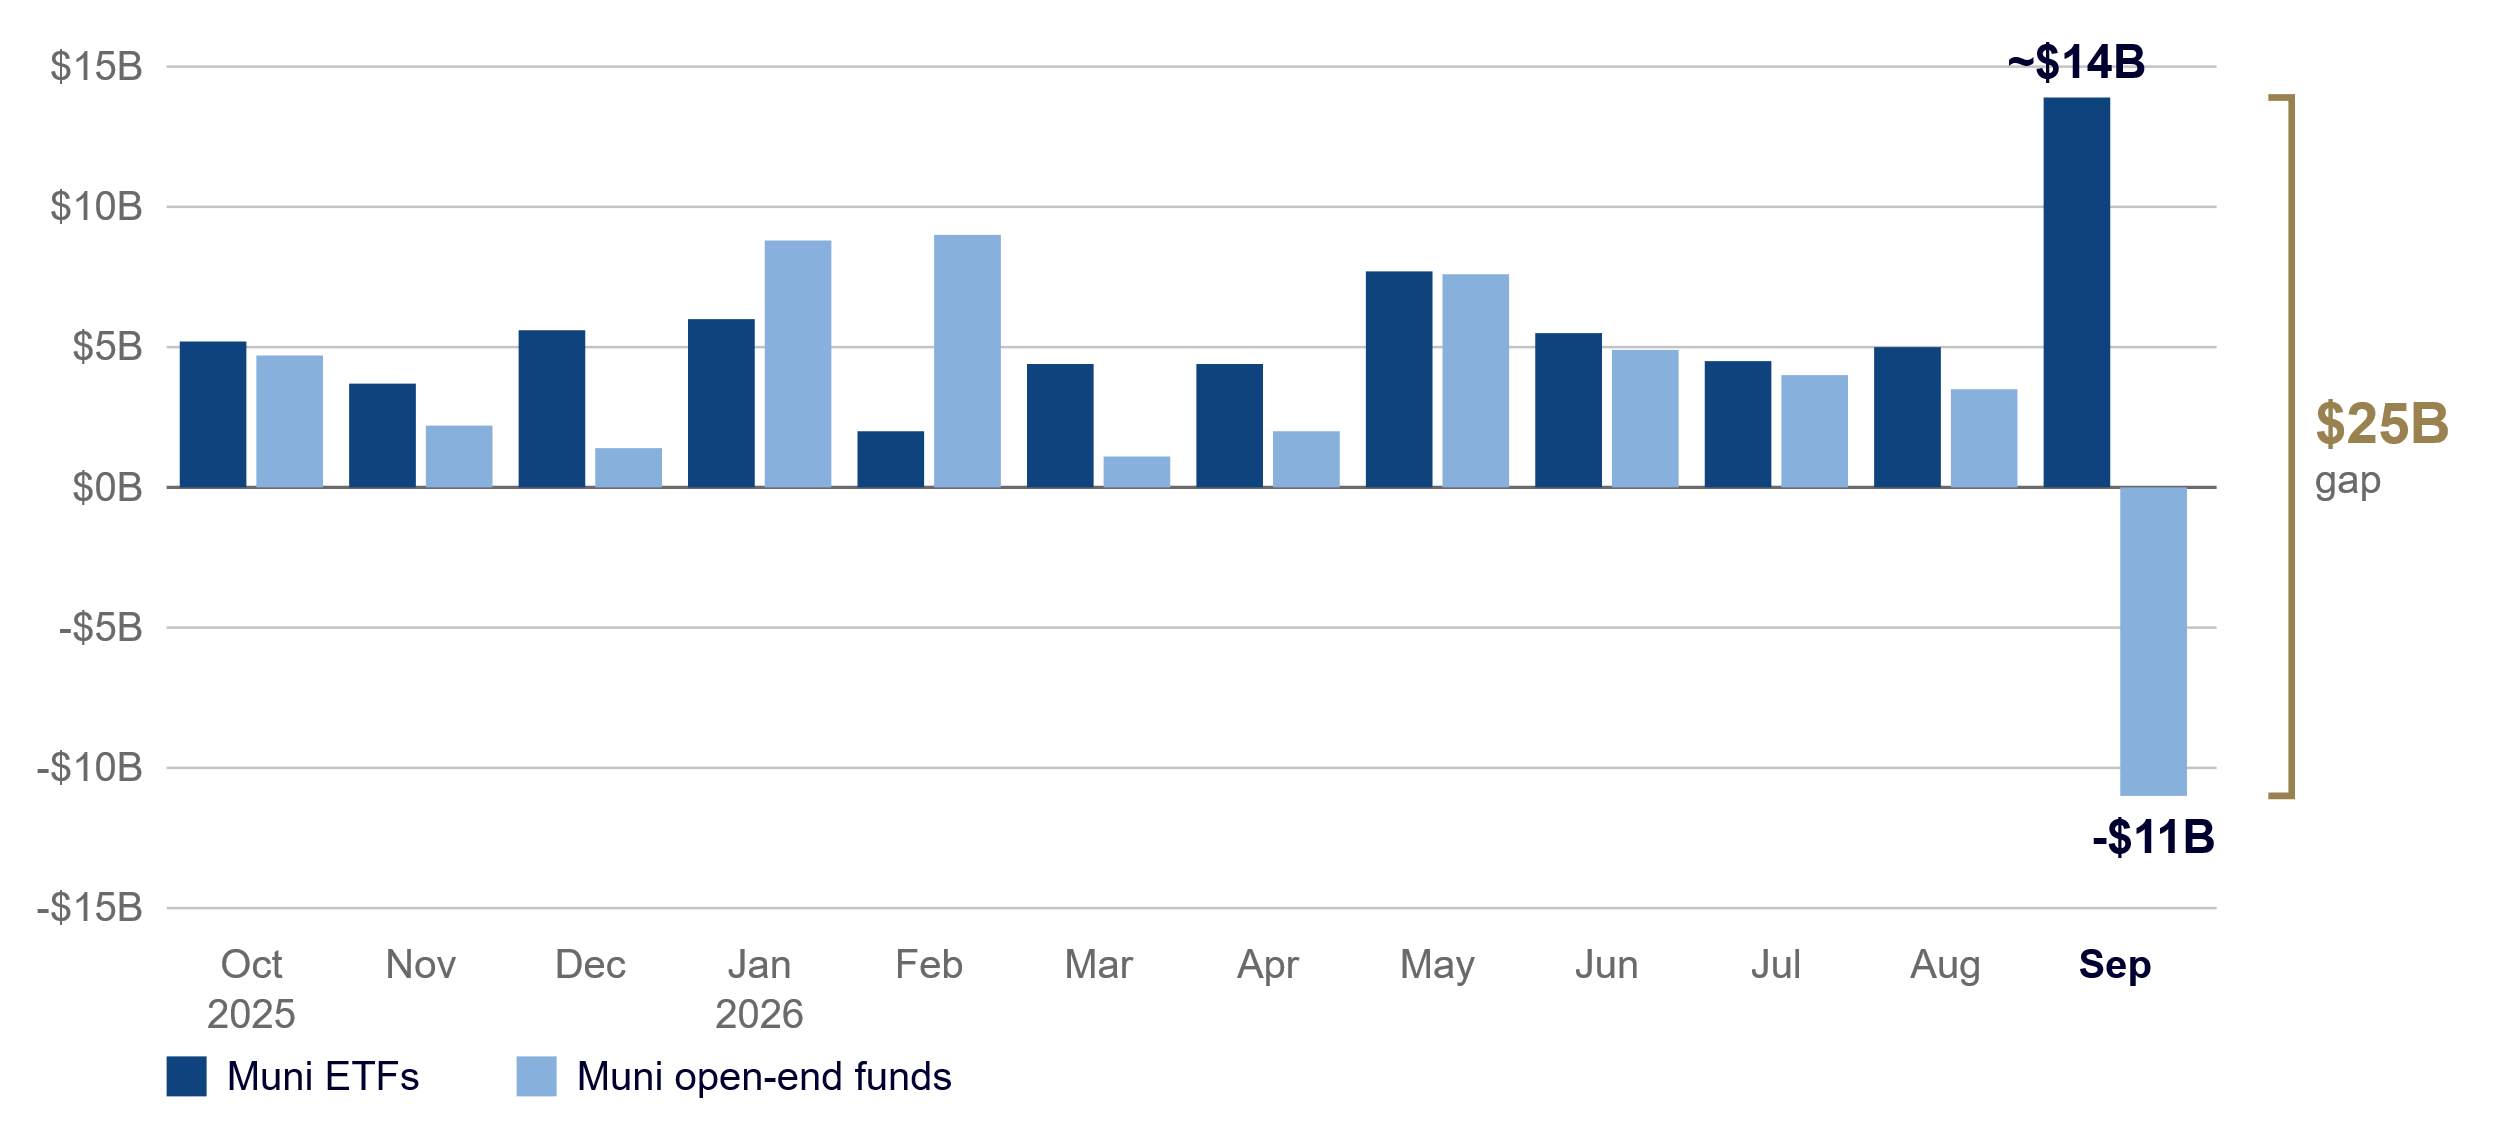
Source: Morningstar Direct Asset Flows, municipal-bond ETF and open-end fund net flows, Oct 2025–Sep 2026. Data as of 9/30/2026.
Credit quality remains solid
Across every investment-grade rating, munis have defaulted far less often than corporate bonds: BBB munis defaulted at roughly one-third the corporate rate. Moody's counted just 115 rated municipal defaults between 1970 and 2022. Strong tax bases and healthy reserves have helped keep defaults rare. The extra yield on BBB munis over AAA is just 75 basis points, well below the long-run average of 134 basis points, a sign the market sees little credit stress.
Table 2 — Investment-grade munis default far less often than corporates (10-year cumulative, %)
| Rating | IG munis | IG corporates |
| AAA | 0.00 | 0.34 |
| AA | 0.02 | 0.71 |
| A | 0.10 | 1.84 |
| BBB | 1.04 | 3.42 |
Source: Moody's, average 10-year cumulative default rates, 1970–2024.
Accessing munis with VanEck's muni ETFs
Investors can match their muni exposure to their goals. Along the yield curve, SMB, ITM and MLN track short, intermediate and long investment-grade munis, letting advisors decide how much interest rate risk to take for more yield. Along the credit spectrum, SHYD and HYD add high-yield munis for investors who want more income and can accept more credit risk; SHYD keeps duration shorter than HYD. For income seekers, XMPT holds a basket of municipal closed-end funds, which use leverage and often trade at discounts to their net asset value. On September 30, the closed-end funds in XMPT's portfolio traded at an average 3.83% discount to net asset value.
Table 3 — VanEck municipal ETFs
| Ticker | Fund | Role in a portfolio | 30-Day SEC Yield (%) | Taxable-equiv. at 37% (%) | Net Expense ratio (%) |
| SMB | VanEck Short Muni ETF | Short end; lower rate sensitivity | 3.34 | 5.30 | 0.07 |
| ITM | VanEck Intermediate Muni ETF | Core intermediate exposure | 4.01 | 6.37 | 0.18 |
| MLN | VanEck Long Muni ETF | Long end; most yield and rate sensitivity | 4.81 | 7.63 | 0.24 |
| SHYD | VanEck Short High Yield Muni ETF | Higher income, shorter duration | 4.20 | 6.67 | 0.32 |
| HYD | VanEck High Yield Muni ETF | High-yield munis; most income from credit | 4.94 | 7.84 | 0.32 |
| XMPT | VanEck CEF Muni Income ETF | Muni closed-end funds; leverage and discounts | 6.83 | 10.84 | 3.40* |
Source: VanEck fund fact sheets, as of 9/30/2026. Taxable-equivalent yield = SEC yield / (1 – 37%). *XMPT total expense ratio includes 2.99% of acquired fund fees and expenses; management fee 0.40%. Yield alone should not be the basis for an investment decision. See above for standardized performance.
Van Eck Associates Corporation (the “Adviser”) will pay all expenses of the Funds, except for the fee payments under the investment management agreements, acquired fund fees and expenses, interest expense, offering costs, trading expenses, taxes and extraordinary expenses. Notwithstanding the foregoing, the Adviser has agreed to pay the offering costs of the Funds until at least September 1, 2027.
For XMPT only: “Acquired Fund Fees and Expenses” reflect each Fund’s pro rata portion of the expenses charged by the Underlying Funds. These expenses are based on the total expense ratio disclosed in each Underlying Fund’s most recent shareholder report. Because Acquired Fund Fees and Expenses are not borne directly by the Fund, they will not be reflected in the expense information in the Fund’s financial statements, and the information presented in the table will differ from that presented in the Fund’s financial highlights included in the Fund’s reports to shareholders.
Putting Higher Muni Yields to Work
After the third-quarter selloff, AAA munis yield 4.58%, the highest month-end level since 2008, and the move came from rising rates and inflation rather than credit stress. For investors in the 22% bracket or higher, the taxable-equivalent yield beats the 5.56% yield on the U.S. Aggregate, and the long end of the curve offers the most income for those who can accept more interest rate risk. Credit quality remains solid, with investment-grade munis defaulting far less often than similarly rated corporates, while record ETF inflows show investors increasingly choosing the ETF structure. For advisors and investors looking to put today's higher yields to work, VanEck's muni ETFs offer a way to choose exposure along the yield curve and credit spectrum to match different income goals and risk tolerances.

Important Disclosures
This is not an offer to buy or sell, or a recommendation to buy or sell any of the securities, financial instruments or digital assets mentioned herein. The information presented does not involve the rendering of personalized investment, financial, legal, tax advice, or any call to action. Certain statements contained herein may constitute projections, forecasts and other forward-looking statements, which do not reflect actual results, are for illustrative purposes only, are valid as of the date of this communication, and are subject to change without notice. Actual future performance of any assets or industries mentioned are unknown. Information provided by third party sources are believed to be reliable and have not been independently verified for accuracy or completeness and cannot be guaranteed. VanEck does not guarantee the accuracy of third party data. The information herein represents the opinion of the author(s), but not necessarily those of VanEck or its other employees.
Past performance is not indicative of future results. Yield figures and tax-equivalent yield calculations presented herein are for illustrative purposes only, based on assumed tax rates and market conditions. Actual results will vary based on individual tax circumstances and market conditions.
The yields and market values of municipal securities may be more affected by changes in tax rates and policies than similar income-bearing taxable securities. Certain investors incomes may be subject to the Federal Alternative Minimum Tax (AMT) and taxable gains are also possible.
There are inherent risks with fixed income investing. These risks may include interest rate, call, credit, market, inflation, government policy, liquidity, or junk bond. When interest rates rise, bond prices fall. This risk is heightened with investments in longer duration fixed-income securities and during periods when prevailing interest rates are low or negative.
Investments in below-investment-grade debt securities which are usually called “high-yield” or “junk bonds,” are typically in weaker financial health and such securities can be harder to value and sell and their prices can be more volatile than more highly rated securities. While these securities generally have higher rates of interest, they also involve greater risk of default than do securities of a higher-quality rating.
ICE Broad High Yield Crossover Municipal Index (MHYX) is intended to track the overall performance of the U.S. dollar denominated high yield long-term tax-exempt bond market.
An investment in the Funds may be subject to risks which include, but are not limited to, risks related to municipal securities, high yield securities, credit, interest rate, state, call, private activity bonds, industrial development bond, special tax bond, market, operational, sampling, index tracking, tax, authorized participant concentration, no guarantee of active trading market, trading issues, passive management, fund shares trading, premium/discount and liquidity of fund shares and concentration risks, all of which may adversely affect the Funds. High-yield municipal bonds are subject to greater risk of loss of income and principal than higher-rated securities, and are likely to be more sensitive to adverse economic changes or individual municipal developments than those of higher-rated securities. Municipal bonds may be less liquid than taxable bonds. A portion of the dividends you receive may be subject to the federal alternative minimum tax (AMT). There is no guarantee that the Funds’ income will be exempt from federal, state or local income taxes, and changes in those tax rates or in alternative minimum tax rates or in the tax treatment of municipal bonds may make them less attractive as investments and cause them to lose value. Capital gains, if any, are subject to capital gains tax.
Investing involves substantial risk and high volatility, including possible loss of principal. Bonds and bond funds will decrease in value as interest rates rise. An investor should consider the investment objective, risks, charges and expenses of the Fund carefully before investing. To obtain a prospectus and summary prospectus, which contains this and other information, call 800.826.2333 or visit vaneck.com/etfs. Please read the prospectus and summary prospectus carefully before investing.
© Van Eck Securities Corporation, Distributor, a wholly owned subsidiary of Van Eck Associates Corporation.
Related Funds
Important Disclosures
This is not an offer to buy or sell, or a recommendation to buy or sell any of the securities, financial instruments or digital assets mentioned herein. The information presented does not involve the rendering of personalized investment, financial, legal, tax advice, or any call to action. Certain statements contained herein may constitute projections, forecasts and other forward-looking statements, which do not reflect actual results, are for illustrative purposes only, are valid as of the date of this communication, and are subject to change without notice. Actual future performance of any assets or industries mentioned are unknown. Information provided by third party sources are believed to be reliable and have not been independently verified for accuracy or completeness and cannot be guaranteed. VanEck does not guarantee the accuracy of third party data. The information herein represents the opinion of the author(s), but not necessarily those of VanEck or its other employees.
Past performance is not indicative of future results. Yield figures and tax-equivalent yield calculations presented herein are for illustrative purposes only, based on assumed tax rates and market conditions. Actual results will vary based on individual tax circumstances and market conditions.
The yields and market values of municipal securities may be more affected by changes in tax rates and policies than similar income-bearing taxable securities. Certain investors incomes may be subject to the Federal Alternative Minimum Tax (AMT) and taxable gains are also possible.
There are inherent risks with fixed income investing. These risks may include interest rate, call, credit, market, inflation, government policy, liquidity, or junk bond. When interest rates rise, bond prices fall. This risk is heightened with investments in longer duration fixed-income securities and during periods when prevailing interest rates are low or negative.
Investments in below-investment-grade debt securities which are usually called “high-yield” or “junk bonds,” are typically in weaker financial health and such securities can be harder to value and sell and their prices can be more volatile than more highly rated securities. While these securities generally have higher rates of interest, they also involve greater risk of default than do securities of a higher-quality rating.
ICE Broad High Yield Crossover Municipal Index (MHYX) is intended to track the overall performance of the U.S. dollar denominated high yield long-term tax-exempt bond market.
An investment in the Funds may be subject to risks which include, but are not limited to, risks related to municipal securities, high yield securities, credit, interest rate, state, call, private activity bonds, industrial development bond, special tax bond, market, operational, sampling, index tracking, tax, authorized participant concentration, no guarantee of active trading market, trading issues, passive management, fund shares trading, premium/discount and liquidity of fund shares and concentration risks, all of which may adversely affect the Funds. High-yield municipal bonds are subject to greater risk of loss of income and principal than higher-rated securities, and are likely to be more sensitive to adverse economic changes or individual municipal developments than those of higher-rated securities. Municipal bonds may be less liquid than taxable bonds. A portion of the dividends you receive may be subject to the federal alternative minimum tax (AMT). There is no guarantee that the Funds’ income will be exempt from federal, state or local income taxes, and changes in those tax rates or in alternative minimum tax rates or in the tax treatment of municipal bonds may make them less attractive as investments and cause them to lose value. Capital gains, if any, are subject to capital gains tax.
Investing involves substantial risk and high volatility, including possible loss of principal. Bonds and bond funds will decrease in value as interest rates rise. An investor should consider the investment objective, risks, charges and expenses of the Fund carefully before investing. To obtain a prospectus and summary prospectus, which contains this and other information, call 800.826.2333 or visit vaneck.com/etfs. Please read the prospectus and summary prospectus carefully before investing.
© Van Eck Securities Corporation, Distributor, a wholly owned subsidiary of Van Eck Associates Corporation.