The Nuclear Reset: What Changed, and What Didn't
July 23, 2026
Read Time 10+ MIN
Key Takeaways
- The NLR ETF's sharp pullback in 2026 reflects a sentiment shift, not a breakdown in the nuclear and uranium thesis.
- Policy support and demand for nuclear power continued to broaden even as equity prices declined.
- The uranium supply deficit remains a long-term structural imbalance.
The last few months have been humbling for anyone invested in nuclear power and uranium. After three exceptional years, the VanEck Uranium and Nuclear ETF (NLR) and its underlying index have pulled back sharply through July 17, 2026, down roughly 15% year to date and about 35% from their peak on January 28, 2026. However, a sharp move in stock prices is not the same thing as a change in the underlying thesis. It appears that most of what has happened in 2026 reflects a shift in sentiment, positioning, and valuation, not a breakdown in the fundamentals that drew investors to this space in the first place.
Click here for NLR standardized performance.
The performance data quoted represents past performance. Past performance is not a guarantee of future results. Investment return and principal value of an investment will fluctuate so that an investor's shares, when redeemed, may be worth more or less than their original cost. Performance may be lower or higher than performance data quoted. Please call 800.826.2333 or visit vaneck.com for performance current to the most recent month ended.
A Look Back at Nuclear and Uranium Sector Performance
It helps to remember just how far and how fast the sector advanced. NLR posted returns of roughly 35.8% in 2023, 14.7% in 2024, and 55.8% in 2025. Three consecutive positive years, capped by a powerful 2025, will attract attention and capital, and this theme certainly did.
Nuclear and uranium were not alone. They were one piece of a much larger trade tied to the enormous capital spending of the big tech hyperscalers, including Alphabet, Meta, Microsoft, and Amazon. As those companies committed hundreds of billions of dollars to build out AI data centers and related infrastructure, investors bid up nearly everything in the supply chain that stood to benefit:
- Semiconductors and memory chips
- Electrical equipment and power generation of all kinds
- Copper and other industrial and strategic metals, including rare earths
Nuclear power fit neatly into that narrative as the clean, reliable, around-the-clock electricity source that AI-era demand would require. That is a sound long-term argument. But it is worth acknowledging that a share of the 2023 to 2025 gains came from investor enthusiasm, momentum, and expanding valuation multiples rather than from a comprehensive matching jump in current earnings. When a theme is priced on the future, sentiment can carry it a long way up. It can also carry it some of the way back down.
The 2026 AI Unwind: Impact on Nuclear and Uranium Stocks
NLR peaked on January 28, 2026, and most of the decline since then has clustered around and after the first quarter hyperscaler earnings calls, with the selling accelerating from mid-May onward. As the year progressed, investors moved from celebrating the scale of AI spending to questioning it. How quickly will these investments earn a return? Will capital spending keep growing at the same pace? Can the power actually be delivered on the timelines being promised? That change in tone repriced the most expensive, most story-driven corners of the market, and nuclear and uranium equities sat squarely in that group.
Within the space, the pain has been uneven, and that unevenness is telling:
- Pre-revenue reactor developers such as Oklo and NuScale, which trade almost entirely on expectations rather than earnings, have fallen the hardest, in some cases significantly below their highs.
- Uranium miners also came under pressure as risk appetite faded and their share prices began to detach from the underlying uranium price.
- Established power producers like Constellation, which generate real cash flow today, held up far better. Several reaffirmed guidance during first-quarter earnings, and one was even upgraded to investment grade.
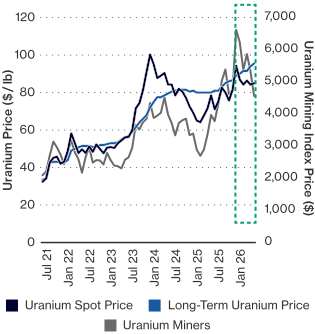
If the demand thesis were truly breaking, we should expect it to show up in the commodity. It has not. Uranium spot prices, after briefly reaching their 2026 peak in January, have been broadly range-bound in the mid-$80s. More importantly, the long-term uranium price, which is the number tied to actual utility contracting, has continued to climb, reaching roughly $95 per pound, its highest level in about 18 years. In other words, the mining equities sold off hard while the commodity that underpins them held firm and even strengthened. That is the signature of a sentiment unwind, not necessarily a collapse in demand.
Uranium Miners Fell as Spot Prices Remained Range-Bound and Long-Term Prices Rose
5-Year Commodity and Mining Index Prices as of 6/30/2026
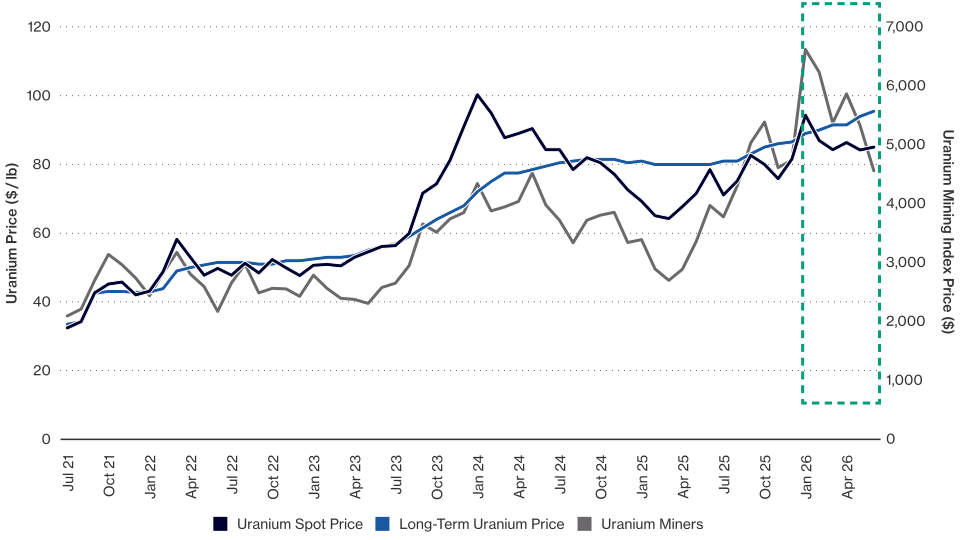
Source: Morningstar; Cameco; UxC; TradeTech. For illustrative purposes only. Past performance is no guarantee of future results. Index performance is not representative of fund performance. It is not possible to invest directly in an index. Please see index definitions and other important disclosures at the end of this content. Uranium Miners represents the VettaFi Global Uranium Mining Index.
Meanwhile, the news beneath the surface has been encouraging. A few developments from 2026 stand out:
- Washington put real money behind large reactors. In June, the U.S. Department of Energy announced a conditional loan commitment of $17.5 billion to support long-lead components for up to 10 large reactors, largely Westinghouse AP1000 units. Each reactor would produce about 1.1 gigawatts, enough combined output to power close to 10 million homes.
- Demand broadened beyond Big Tech. Walmart signed its first nuclear power purchase agreement, contracting for about 176 megawatts from Constellation's Dresden plant in Illinois over two 15-year terms. It was among the first such deals between a major retailer and a nuclear facility, a useful reminder that the appetite for reliable, carbon-free power is not limited to hyperscalers.
- Advanced reactors hit a milestone. Antares brought its Mark-0 microreactor to criticality at Idaho National Laboratory, becoming the first privately developed advanced reactor to reach that point in the U.S. in more than four decades, and doing so ahead of the administration's July 4 target. Several other developers reached similar milestones around the same deadline.
There was more, including Canada's new national nuclear strategy, a major expansion of U.S. uranium enrichment capacity by Urenco, a 20-year life extension for California's Diablo Canyon plant, and continued progress on reactor restarts. None of it was enough to offset the sentiment-driven selling, but all of it is the kind of tangible progress that tends to matter over time.
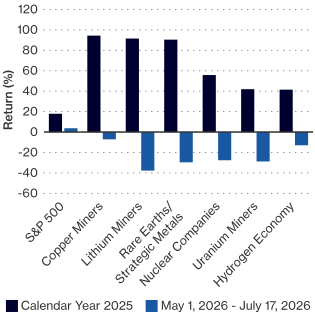
It is also worth remembering that nuclear was not singled out. The same de-rating swept through other richly valued, AI-levered parts of the market, from certain data center names to the broader power and electrical-equipment complex to copper, strategic, and rare earth metals producers. When investors decide to take risk off a crowded trade, they rarely do it one sector at a time.
Unwind in Themes Levered to the AI Trade
Return (%) in 2025 vs. Recent Months
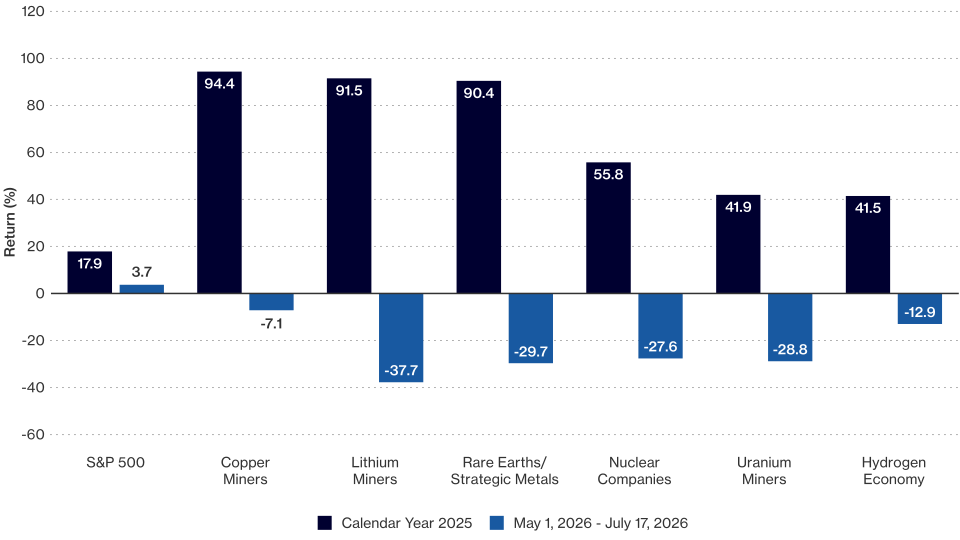
Source: Morningstar. Past performance is no guarantee of future results. Index performance is not representative of fund performance. It is not possible to invest directly in an index. Please see index definitions and other important disclosures at the end of this content. Fund performance current to the most recent month end is available by visiting vaneck.com or by calling 800.826.2333. Copper Miners: Solactive Global Copper Miners Index; Lithium Miners: Solactive Global Lithium Index; Rare Earths/Strategic Metals: MVIS Global Rare Earth/Strategic Metals Index; Nuclear Companies: MVIS Global Uranium & Nuclear Energy Index; Uranium Miners: VettaFi Global Uranium Mining Index: Hydrogen Economy: Solactive Hydrogen Economy Index.
Long-Term Outlook for Uranium and Nuclear Energy Investing
So where does that leave investors? It can be useful to separate the near term from the long term. On the long-term demand side, the case is, if anything, firmer than it was a year ago. But timing is where expectations most often get ahead of reality:
- New reactors take time. Both large reactors and small modular reactors carry multi-year, sometimes decade-long, timelines from decision to first power, and 2026 has offered plenty of reminders that schedules slip. The nearest-term nuclear megawatts are not new builds at all. They are restarts, efficiency upgrades, and life extensions of the existing fleet.
- The catalysts to watch are contracting and execution. Utilities have been under-contracted for well over a decade. A meaningful acceleration in long-term uranium contracting, more corporate power deals, and continued policy follow-through would all help close the gap between share prices and fundamentals.
- The supply picture is the anchor. Even at today's prices, uranium supply cannot respond quickly. Large deposits are hard to find and slow to permit and build. Industry forecasts point to uncovered uranium requirements of more than 3 billion pounds through 2045, which would require roughly a doubling of primary production. That is a structural imbalance, not a passing one.
Recommended subscription
The Bottom Line for the Nuclear Trade
Simply put, the nuclear and uranium trade seems to have gotten expensive, rode the same wave of AI enthusiasm that lifted much of the market, and has now given a chunk of that back as sentiment turned and investors began demanding proof rather than promise. That is uncomfortable, but it is not the same as the story being wrong. The commodity has held, policy support has strengthened, demand has broadened, and the supply deficit remains. What changed was the price investors were willing to pay, not the reasons to be there.
Volatility comes with the territory for a theme tied to such innovative and unpredictable technology. It is a big part of why we built NLR the way we did. Rather than making a single bet on one segment of the nuclear ecosystem, the VanEck Uranium and Nuclear ETF (NLR) offers exposure across the entire value chain: the utilities and power producers generating electricity today, the uranium miners supplying the fuel, and the companies building the next generation of reactors. In a year when the drawdown has been so uneven, with utilities holding on and developers falling hard, that breadth is the point. It lets investors participate in the long-term nuclear story without having to be right about which single name wins. Time will tell where the market moves from here, but one thing seems apparent: the entry point for exposure to the nuclear value chain appears more attractive than it was a few months ago.
NLR | VanEck Uranium and Nuclear ETF
To receive more Natural Resources insights, sign up in our subscription center.

Important Disclosures
Average Annual Total Returns (%)
As of 6/30/2026
| YTD | 1 Year | 3 Year | 5 Year | 10 Year | Inception 8/13/2007 |
|
| NLR (NAV) | -6.27 | 7.37 | 28.09 | 19.99 | 11.80 | 3.16 |
| NLR (Price) | -6.62 | 6.92 | 28.21 | 19.96 | 11.91 | 3.16 |
| MVIS Global Uranium & Nuclear Energy Index | -6.44 | 7.32 | 28.13 | 19.99 | 11.66 | 3.06 |
* Returns less than one year are not annualized.
Index data prior to March 24, 2014 reflects that of the DAXglobal Nuclear Energy Index (DXNE). From March 24, 2014, forward, the index data reflects that of the Fund's underlying index, MVIS Global Uranium & Nuclear Energy Index (MVNLRTR). Index history which includes periods prior to March 24, 2014 reflects a blend of the performance of DXNE and MVNLRTR and is not intended for third party use.
The performance data quoted represents past performance. Past performance is not a guarantee of future results. Investment return and principal value of an investment will fluctuate so that an investor's shares, when redeemed, may be worth more or less than their original cost. Performance may be lower or higher than performance data quoted. Please call 800.826.2333 or visit vaneck.com for performance current to the most recent month ended.
Gross Expense Ratio: 0.52%
This is not an offer to buy or sell, or a recommendation to buy or sell any of the securities, financial instruments or digital assets mentioned herein. The information presented does not involve the rendering of personalized investment, financial, legal, tax advice, or any call to action. Certain statements contained herein may constitute projections, forecasts and other forward-looking statements, which do not reflect actual results, are for illustrative purposes only, are valid as of the date of this communication, and are subject to change without notice. Actual future performance of any assets or industries mentioned are unknown. Information provided by third party sources are believed to be reliable and have not been independently verified for accuracy or completeness and cannot be guaranteed. VanEck does not guarantee the accuracy of third-party data. The information herein represents the opinion of the author(s), but not necessarily those of VanEck or its other employees.
An investment in the Fund may be subject to risks which include, but are not limited to, risks related to investments in nuclear energy companies, energy sector, utilities sector, industrials sector, special risk considerations of investing in Asian, Canadian, European and Australian issuers, foreign securities, foreign currency, depositary receipts, small- and medium-capitalization companies, cash transactions, equity securities, market, operational, index tracking, authorized participant concentration, no guarantee of active trading market, trading issues, passive management, fund shares trading, premium/discount and liquidity of fund shares, issuer-specific changes, non-diversified, index-related concentration and high portfolio turnover risks, all of which may adversely affect the Fund. Foreign investments are subject to risks, which include changes in economic and political conditions, foreign currency fluctuations, changes in foreign regulations, and changes in currency exchange rates that may negatively impact the Fund's return. Small- and medium-capitalization companies may be subject to elevated risks.
Definitions: Solactive Global Copper Miners Index tracks international companies engaged in copper exploration, mining, and refining. Solactive Global Lithium Index tracks the largest, most liquid listed companies active in lithium exploration or mining, or in the production of lithium batteries. MVIS Global Rare Earth/Strategic Metals Index tracks the largest, most liquid companies in the global rare earth and strategic metals industry, spanning producers, refiners, and recyclers of rare earth and strategic metals and minerals. MVIS Global Uranium & Nuclear Energy Index tracks the largest and most liquid companies operating across the global uranium and nuclear energy industries. VettaFi Global Uranium Mining Index tracks companies engaged in uranium mining, exploration, development, and production, along with those holding physical uranium, uranium royalties, or other non-mining assets. Solactive Hydrogen Economy Index tracks companies worldwide that are engaged in the hydrogen industry, from hydrogen producers to makers of enabling technologies such as fuel cells and electrolyzers.
Investing involves substantial risk and high volatility, including possible loss of principal. An investor should consider the investment objective, risks, charges and expenses of the Fund carefully before investing. To obtain a prospectus and summary prospectus, which contains this and other information, call 800.826.2333 or visit vaneck.com/etfs. Please read the prospectus and summary prospectus carefully before investing.
© 2026 Van Eck Securities Corporation, Distributor, a wholly owned subsidiary of Van Eck Associates Corporation.
Related Funds
Important Disclosures
Average Annual Total Returns (%)
As of 6/30/2026
| YTD | 1 Year | 3 Year | 5 Year | 10 Year | Inception 8/13/2007 |
|
| NLR (NAV) | -6.27 | 7.37 | 28.09 | 19.99 | 11.80 | 3.16 |
| NLR (Price) | -6.62 | 6.92 | 28.21 | 19.96 | 11.91 | 3.16 |
| MVIS Global Uranium & Nuclear Energy Index | -6.44 | 7.32 | 28.13 | 19.99 | 11.66 | 3.06 |
* Returns less than one year are not annualized.
Index data prior to March 24, 2014 reflects that of the DAXglobal Nuclear Energy Index (DXNE). From March 24, 2014, forward, the index data reflects that of the Fund's underlying index, MVIS Global Uranium & Nuclear Energy Index (MVNLRTR). Index history which includes periods prior to March 24, 2014 reflects a blend of the performance of DXNE and MVNLRTR and is not intended for third party use.
The performance data quoted represents past performance. Past performance is not a guarantee of future results. Investment return and principal value of an investment will fluctuate so that an investor's shares, when redeemed, may be worth more or less than their original cost. Performance may be lower or higher than performance data quoted. Please call 800.826.2333 or visit vaneck.com for performance current to the most recent month ended.
Gross Expense Ratio: 0.52%
This is not an offer to buy or sell, or a recommendation to buy or sell any of the securities, financial instruments or digital assets mentioned herein. The information presented does not involve the rendering of personalized investment, financial, legal, tax advice, or any call to action. Certain statements contained herein may constitute projections, forecasts and other forward-looking statements, which do not reflect actual results, are for illustrative purposes only, are valid as of the date of this communication, and are subject to change without notice. Actual future performance of any assets or industries mentioned are unknown. Information provided by third party sources are believed to be reliable and have not been independently verified for accuracy or completeness and cannot be guaranteed. VanEck does not guarantee the accuracy of third-party data. The information herein represents the opinion of the author(s), but not necessarily those of VanEck or its other employees.
An investment in the Fund may be subject to risks which include, but are not limited to, risks related to investments in nuclear energy companies, energy sector, utilities sector, industrials sector, special risk considerations of investing in Asian, Canadian, European and Australian issuers, foreign securities, foreign currency, depositary receipts, small- and medium-capitalization companies, cash transactions, equity securities, market, operational, index tracking, authorized participant concentration, no guarantee of active trading market, trading issues, passive management, fund shares trading, premium/discount and liquidity of fund shares, issuer-specific changes, non-diversified, index-related concentration and high portfolio turnover risks, all of which may adversely affect the Fund. Foreign investments are subject to risks, which include changes in economic and political conditions, foreign currency fluctuations, changes in foreign regulations, and changes in currency exchange rates that may negatively impact the Fund's return. Small- and medium-capitalization companies may be subject to elevated risks.
Definitions: Solactive Global Copper Miners Index tracks international companies engaged in copper exploration, mining, and refining. Solactive Global Lithium Index tracks the largest, most liquid listed companies active in lithium exploration or mining, or in the production of lithium batteries. MVIS Global Rare Earth/Strategic Metals Index tracks the largest, most liquid companies in the global rare earth and strategic metals industry, spanning producers, refiners, and recyclers of rare earth and strategic metals and minerals. MVIS Global Uranium & Nuclear Energy Index tracks the largest and most liquid companies operating across the global uranium and nuclear energy industries. VettaFi Global Uranium Mining Index tracks companies engaged in uranium mining, exploration, development, and production, along with those holding physical uranium, uranium royalties, or other non-mining assets. Solactive Hydrogen Economy Index tracks companies worldwide that are engaged in the hydrogen industry, from hydrogen producers to makers of enabling technologies such as fuel cells and electrolyzers.
Investing involves substantial risk and high volatility, including possible loss of principal. An investor should consider the investment objective, risks, charges and expenses of the Fund carefully before investing. To obtain a prospectus and summary prospectus, which contains this and other information, call 800.826.2333 or visit vaneck.com/etfs. Please read the prospectus and summary prospectus carefully before investing.
© 2026 Van Eck Securities Corporation, Distributor, a wholly owned subsidiary of Van Eck Associates Corporation.