2026 Semiconductor Stock Selloff: The Long-Term Outlook
November 19, 2026
Read Time 8 min read
- Recent semiconductor volatility reflects crowded positioning, data center permitting politics, company guidance and the unwinding of leveraged positions. The long-term demand case for AI compute is unchanged.
- Political and power constraints are expected to extend the timeline of the data center buildout rather than reduce overall demand, which may favor chips that deliver the most compute per megawatt.
- Dispersion between stronger and weaker semiconductor companies is likely to widen, with memory and smaller cloud providers facing greater pressure.
- Leadership within the semiconductor industry changes over time, which supports a diversified approach across each layer of the AI stack with a semiconductor ETF like SMH.
Chip stocks have been through a violent stretch, and the right response is to widen the lens, not shrink it. This is not a call on the next week or the next month. Our view is that the pullbacks change the timing of the AI buildout and the gap between stronger and weaker names, and leave the ten-year case for AI compute where it was.
That is also how we think about owning a trend like this. Big technology cycles do not move in straight lines, and pullbacks tend to arrive when a trade gets crowded and outside pressures stack up at once. It is also why we own the trend across the whole stack rather than betting on a single name or layer. This post covers what has happened, how our semiconductor analyst Angus Shillington reads it, why leadership in this group rotates, where valuation sits, and what history says about drawdowns like this one.
What’s Happening with Semi Stocks
SMH fell 11.6% on November 5, its worst day since March 2020, after the midterm elections added political risk to an AI trade that was already crowded. Voters approved restrictions in 40 of 41 local data center ballot measures, and UBS estimates about 30% of expected 2028 US data center additions could now be at risk. Most of the 2027 build is already underway.
Click here for SMH Standardized Performance
Past performance is no guarantee of future results. Investment return and principal value will fluctuate; shares may be worth more or less than original cost when redeemed. Current performance may be lower or higher. Call 800.826.2333 or visit vaneck.com for month-end performance.
Politics was not the whole story. Qualcomm and Arm guided below expectations, Micron paused a planned Taiwan plant, and leveraged positions were unwound, which tends to make selling feed on itself. As of November 5, SMH was about 33% below its June high and still up roughly 24% for the year.
Volatility has not eased since. SMH's NAV recovered above $500 on November 11, then slipped again, and as of November 13 it was about 27% below its June 22 high and up about 35% for the year.
Will Semi Volatility Change Demand
The demand case for AI compute is intact, and the open question is how fast capacity gets built, not whether it is needed. AI remains one of our ten macro themes. Jan van Eck's Q4 outlook sees AI compute reaching about 62 GW by 2030, roughly five times today's fleet, with inference growing from 30% to 81% of that compute.
The same outlook named politics and debt markets, alongside fab capacity and electricity, as pressure points to expect along the way. This week's catalyst was on our radar, even if its timing was not. A ten-year view allows for change that arrives fast and with a wide range of outcomes, and that is the reason to hold one.
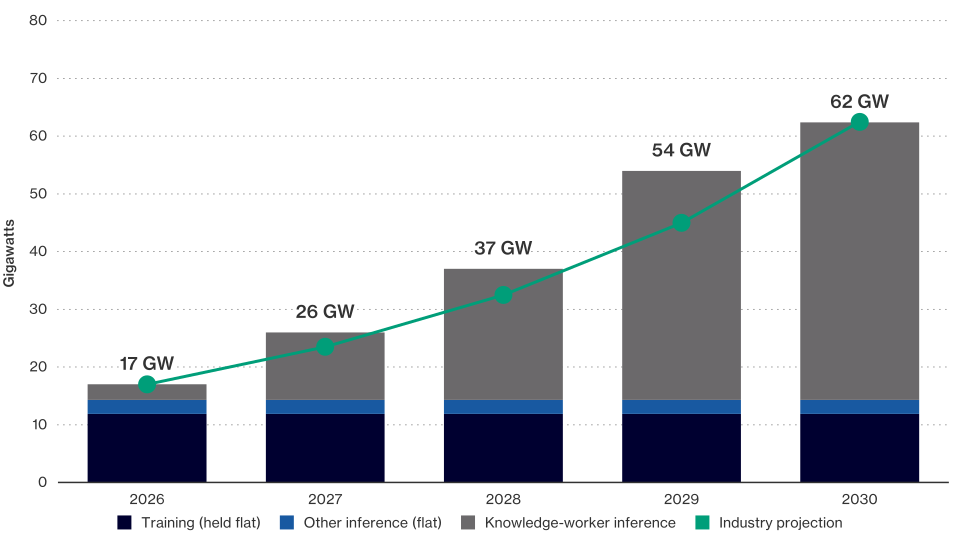
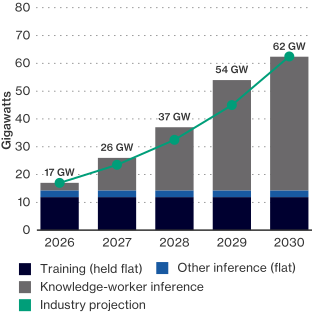
Source: Source: VanEck analysis; DC Market Insights (12.4 GW AI capacity 2025, 62.4 GW 2030 base case, interpolated); Yield Theory (big-four capex). Today’s ~17 GW split 30% inference / 70% training; training and other inference held flat. Knowledge-worker inference = seats plus agents on the indicative path. Capex at $45bn per GW new build, $30bn re-chipped, spent a year ahead. For illustrative purposes only. Not intended as a forecast or prediction of future results.
Recommended subscription
Data Center Timeline
Angus Shillington, our Global Semiconductor Analyst, sees politics joining power as a limit on how fast data centers get built, and expects that to stretch the buildout rather than shrink it. Demand for compute has not changed. If new sites are harder to approve, companies have to upgrade the data centers they already have, and faster. That may favor chips that get the most out of every megawatt. In his opinion, Nvidia or Broadcom unit numbers may not come down much, if at all, though we will not know for a quarter or two, and he does not see this as the bubble bursting.
He is more careful on memory, where supply could catch up as installations slip, and on smaller cloud providers that need both new funding and new permits to grow.
He also points to why the moves feel so large. There is a lot of leveraged money in this trade, and forced selling feeds on itself when buyers step back. At the same time, investors are rotating into non-AI names they were underweight. When everything trades together, the best names often get hit hardest simply because they are what people own, and that usually does not last.
His takeaway: expect a wider gap between stronger and weaker names, and expect positioning to stay light until near-term growth is easier to call.
SMH ETF Nvidia Exposure
Nvidia has been SMH's largest holding at every year end since 2023, but the top spot has not always been its own. Going back to 2011, the largest holding has changed hands twice: Intel through 2018, TSMC from 2019 to 2022, and Nvidia since.
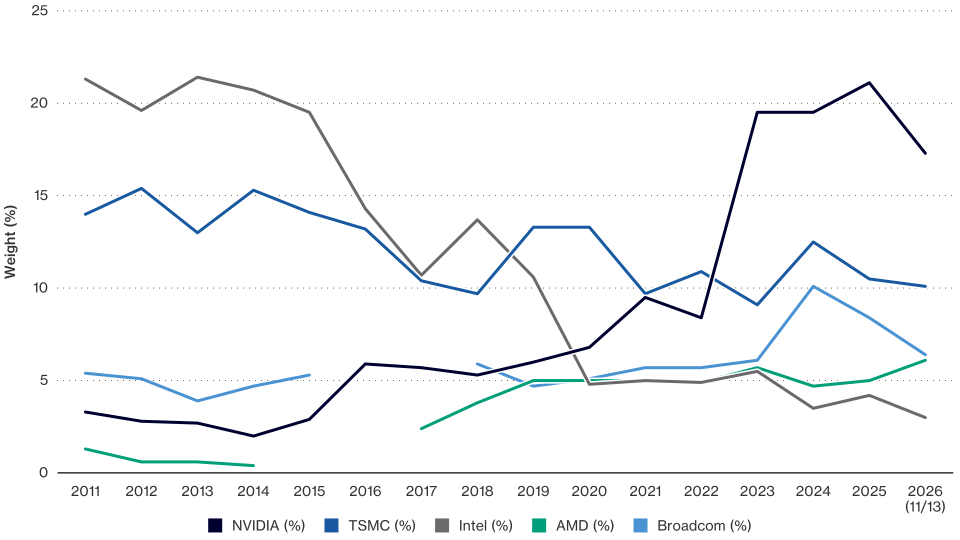
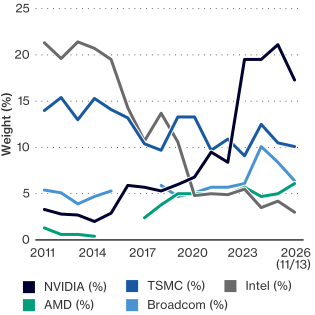
Year-end weights. Through 2019: MarketVector US Listed Semiconductor 25 index, normalized to 100%. From 2020: SMH holdings. 2026 as of November 13. Source: VanEck data warehouse.
The rest of the top 10 has turned over too. Nineteen different companies have held a top-10 spot at a year end since 2011, and only four of the 2011 top 10 are still there today: TSMC, Texas Instruments, Analog Devices and KLA. The group changes gradually, with about nine of ten names carrying over from one year end to the next, but over a decade it becomes a different list.
That is the case for how SMH is built. It is a passive, rules-based index of the largest and most liquid US-listed semiconductor companies, and weights follow market value within the index's caps and rebalancing rules. Nvidia grew from 5.9% of the index at the end of 2016 to 21.1% at the end of 2025 because its market value grew, not because anyone picked it. Intel moved the other way, from 21.3% in 2011 to 3.0% today. AMD was under 1% of the index from 2012 to 2014, was absent at the 2015 and 2016 year ends, and is 6.1% today, while Broadcom's weight peaked at 10.1% at the end of 2024. (Broadcom is Broadcom Corp. through 2015 and Broadcom Inc. from 2018, and was not in the index at the 2016 and 2017 year ends.) Nobody has to guess who leads the next phase, because the weights adjust as leadership changes.
The demand case does not depend on who wins. Compute demand is not slowing, and we will need more of it whatever the source. It will be built from chips, memory, equipment, foundry capacity and design software supplied by a wide set of companies, which is why we think the right way to allocate to semiconductors is to own the leading companies at each layer of the stack through a focused, passive core. This selloff showed that the layers face different pressures, with memory more exposed than the compute leaders in Angus's view, so diversifying across layers matters more than any one call on who leads next.
SMH Valuation
SMH's trailing P/E was about 28x on November 5, down by roughly a third since January and only modestly above its ten-year average of about 26x.
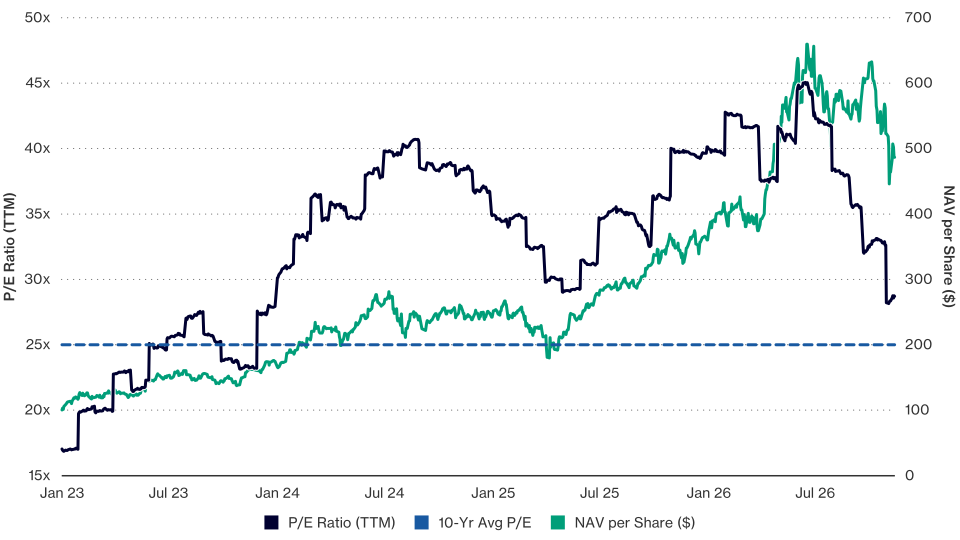
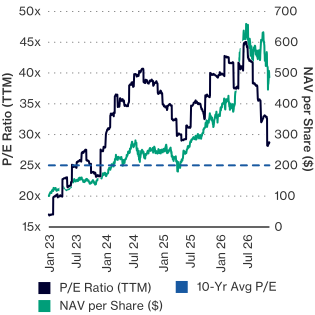
P/E: Morningstar, trailing 12 months, month-end. NAV: VanEck data warehouse, last NAV each month, price-only. Final point November 5, 2026.
The multiple compressed because earnings grew faster than the price, not only because the price fell. From January to early November the P/E dropped by about a third while NAV rose about 11%.
Two cautions. Morningstar refreshes the fund P/E monthly from holdings, so the November 5 figure does not yet reflect the selloff. Scaling the October 31 figure by the NAV decline since then points to roughly 24x, which is our own rough estimate rather than a published number. The measure is also trailing, and Morningstar caps each holding's P/E at 60 and leaves out negative earnings, which flatters the figure a little.
How Has SMH Performed in Previous Drawdowns
SMH has been through four drawdowns of roughly 28% to 45% since 2018 and recovered to new highs after each one. That is history, not a promise, but it is useful context when the headlines are loud. It also shows what owning a long-term trend looks like: the path includes stretches like this one.
Semiconductor Outlook
Three things will tell us more than any single day's tape: hyperscaler capex guidance and how it is funded, how long Texas permitting stays paused, and whether credit conditions tighten alongside equities.
None of this makes the path smoother. A ten-year view of AI does not depend on any one quarter, and it does not require pretending the next one will be calm. Expect volatility, expect the gap between stronger and weaker names to widen, and judge the trend by demand, funding and delivery of capacity rather than by one bad day.
Data as of November 5, 2026 unless noted; holdings history and recent NAV as of November 13, 2026. NAV figures are price-only and exclude distributions. Past performance is not indicative of future results.
SMH | VanEck Semiconductor ETF

IMPORTANT DISCLOSURES
This is not an offer to buy or sell, or a recommendation to buy or sell any of the securities, financial instruments or digital assets mentioned herein. The information presented does not involve the rendering of personalized investment, financial, legal, tax advice, or any call to action. Certain statements contained herein may constitute projections, forecasts and other forward-looking statements, which do not reflect actual results, are for illustrative purposes only, are valid as of the date of this communication, and are subject to change without notice. Actual future performance of any assets or industries mentioned are unknown. Information provided by third party sources are believed to be reliable and have not been independently verified for accuracy or completeness and cannot be guaranteed. VanEck does not guarantee the accuracy of third party data. The information herein represents the opinion of the author(s), but not necessarily those of VanEck or its other employees.
SMH Standardized Performance
| 1 MO | 3 MO | YTD | 1 YR | 3 YR | 5 YR | 10 YR | LIFE 12/20/11 | |
| SMH (NAV) | 9.30 | -7.34 | 68.93 | 86.89 | 62.00 | 37.37 | 34.41 | 29.90 |
| SMH (Market Price) | 9.41 | -7.15 | 69.11 | 87.17 | 62.07 | 37.40 | 34.40 | 29.88 |
| MVIS US Listed Semiconductor 25 Index | 9.31 | -7.34 | 69.19 | 87.30 | 62.35 | 37.61 | 34.52 | 29.94 |
*Returns less than one year are not annualized.
The performance data quoted represents past performance. Past performance is not a guarantee of future results. Investment return and principal value of an investment will fluctuate so that an investor's shares, when redeemed, may be worth more or less than their original cost. Performance may be lower or higher than performance data quoted. Please call 800.826.2333 or visit vaneck.com for performance current to the most recent month ended.
SMH Gross Expense Ratio – 0.35%
Fund Holdings may vary. Visit vaneck.com/smh for a complete list of holdings.
MVIS® US Listed Semiconductor 25 Index (MVSMHTR) is intended to track the overall performance of companies involved in semiconductor production and equipment.
Definitions - Drawdown is the decline in share price from a prior closing peak to the lowest subsequent close, and depth is that peak-to-trough decline expressed as a percentage. Price return reflects share price change only, excluding dividends and the deduction of fees, expenses and sales charges. P/E (price-to-earnings) ratio compares a company’s share price to its earnings per share; a fund’s P/E is derived from the P/Es of its holdings and is not a measure of fund performance or a predictor of future results. NAV (net asset value) is the value per share of a fund’s assets less its liabilities.
An investment in the VanEck Semiconductor ETF (SMH) may be subject to risks which include, among others, risks related to investing in the semiconductor industry, special risk considerations of investing in Taiwanese issuers, equity securities, small-, medium and large-capitalization companies, foreign securities, emerging market issuers, foreign currency, depositary receipts, issuer-specific changes, market, operational, index tracking, authorized participant concentration, new fund, no guarantee of active trading market, trading issues, passive management, fund shares trading, premium/discount and liquidity of fund shares, non-diversified, and index-related concentration risks, all of which may adversely affect the Fund. Small, medium and large-capitalization companies may be subject to elevated risks. Emerging market issuers and foreign securities may be subject to securities markets, political and economic, investment and repatriation restrictions, different rules and regulations, less publicly available financial information, foreign currency and exchange rates, operational and settlement, and corporate and securities laws risks.
Investing involves substantial risk and high volatility, including possible loss of principal. An investor should consider the investment objective, risks, charges and expenses of a Fund carefully before investing. To obtain a prospectus and summary prospectus, which contain this and other information, call 800.826.2333 or visit vaneck.com. Please read the prospectus and summary prospectus carefully before investing.
© 2026 Van Eck Securities Corporation, Distributor, a wholly owned subsidiary of Van Eck Associates Corporation. 666 Third Avenue, New York, NY 10017.
Related Funds
IMPORTANT DISCLOSURES
This is not an offer to buy or sell, or a recommendation to buy or sell any of the securities, financial instruments or digital assets mentioned herein. The information presented does not involve the rendering of personalized investment, financial, legal, tax advice, or any call to action. Certain statements contained herein may constitute projections, forecasts and other forward-looking statements, which do not reflect actual results, are for illustrative purposes only, are valid as of the date of this communication, and are subject to change without notice. Actual future performance of any assets or industries mentioned are unknown. Information provided by third party sources are believed to be reliable and have not been independently verified for accuracy or completeness and cannot be guaranteed. VanEck does not guarantee the accuracy of third party data. The information herein represents the opinion of the author(s), but not necessarily those of VanEck or its other employees.
SMH Standardized Performance
| 1 MO | 3 MO | YTD | 1 YR | 3 YR | 5 YR | 10 YR | LIFE 12/20/11 | |
| SMH (NAV) | 9.30 | -7.34 | 68.93 | 86.89 | 62.00 | 37.37 | 34.41 | 29.90 |
| SMH (Market Price) | 9.41 | -7.15 | 69.11 | 87.17 | 62.07 | 37.40 | 34.40 | 29.88 |
| MVIS US Listed Semiconductor 25 Index | 9.31 | -7.34 | 69.19 | 87.30 | 62.35 | 37.61 | 34.52 | 29.94 |
*Returns less than one year are not annualized.
The performance data quoted represents past performance. Past performance is not a guarantee of future results. Investment return and principal value of an investment will fluctuate so that an investor's shares, when redeemed, may be worth more or less than their original cost. Performance may be lower or higher than performance data quoted. Please call 800.826.2333 or visit vaneck.com for performance current to the most recent month ended.
SMH Gross Expense Ratio – 0.35%
Fund Holdings may vary. Visit vaneck.com/smh for a complete list of holdings.
MVIS® US Listed Semiconductor 25 Index (MVSMHTR) is intended to track the overall performance of companies involved in semiconductor production and equipment.
Definitions - Drawdown is the decline in share price from a prior closing peak to the lowest subsequent close, and depth is that peak-to-trough decline expressed as a percentage. Price return reflects share price change only, excluding dividends and the deduction of fees, expenses and sales charges. P/E (price-to-earnings) ratio compares a company’s share price to its earnings per share; a fund’s P/E is derived from the P/Es of its holdings and is not a measure of fund performance or a predictor of future results. NAV (net asset value) is the value per share of a fund’s assets less its liabilities.
An investment in the VanEck Semiconductor ETF (SMH) may be subject to risks which include, among others, risks related to investing in the semiconductor industry, special risk considerations of investing in Taiwanese issuers, equity securities, small-, medium and large-capitalization companies, foreign securities, emerging market issuers, foreign currency, depositary receipts, issuer-specific changes, market, operational, index tracking, authorized participant concentration, new fund, no guarantee of active trading market, trading issues, passive management, fund shares trading, premium/discount and liquidity of fund shares, non-diversified, and index-related concentration risks, all of which may adversely affect the Fund. Small, medium and large-capitalization companies may be subject to elevated risks. Emerging market issuers and foreign securities may be subject to securities markets, political and economic, investment and repatriation restrictions, different rules and regulations, less publicly available financial information, foreign currency and exchange rates, operational and settlement, and corporate and securities laws risks.
Investing involves substantial risk and high volatility, including possible loss of principal. An investor should consider the investment objective, risks, charges and expenses of a Fund carefully before investing. To obtain a prospectus and summary prospectus, which contain this and other information, call 800.826.2333 or visit vaneck.com. Please read the prospectus and summary prospectus carefully before investing.
© 2026 Van Eck Securities Corporation, Distributor, a wholly owned subsidiary of Van Eck Associates Corporation. 666 Third Avenue, New York, NY 10017.