Is the AI Build-Out Still on Track, and What Is the Semiconductor Selloff Telling Investors?
September 21, 2026
Read Time 9 MIN
Hyperscalers guided capital spending sharply higher; consensus 2026 capex for the five largest US spenders now sits at $844 billion, up 81% year over year. Spending that much, that fast, pushes near-term free cash flows negative. The market priced that gap today and discounted the revenue pool being built.
"The market didn't sell off because the build-out slowed down. It sold off because the build-out sped up."
– Nick Frasse, VanEck Product Manager
Click here for SMH Standardized Performance
Past performance is no guarantee of future results. Investment return and principal value will fluctuate; shares may be worth more or less than original cost when redeemed. Current performance may be lower or higher. Call 800.826.2333 or visit vaneck.com for month-end performance.
How Does the Current AI Chip Drawdown Compare to Prior Semiconductor Cycles?
This is the fourth deepest of seven semiconductor drawdowns since 2011. When compared to 2022, when demand fell and earnings fell with it, this time earnings more than doubled, and what fell was the multiple. TSMC (Taiwan Semiconductor Manufacturing Company Limited, "TSM") outperformed on revenue and profit, guided capex above its prior forecast, and still fell more than 3% the next session.
Historic Semiconductor Drawdown
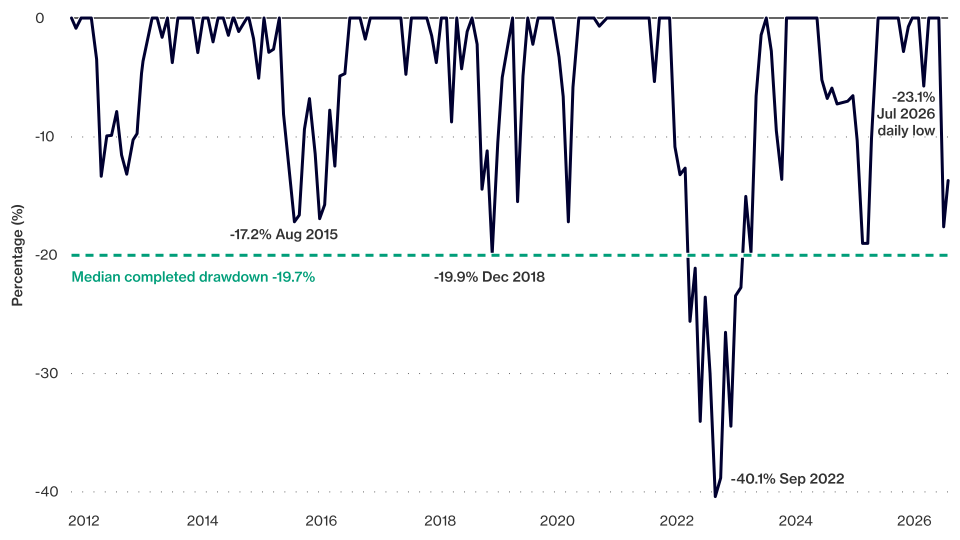
Source: FactSet Global Prices, SMH-US monthly and daily closes, USD, price return (excludes dividends), retrieved August 11, 2026. Past performance is not a guarantee of future results. Fund performance current to the most recent month end is available by visiting vaneck.com or by calling 800.826.2333.
| Median drawdown -19.7% | May 2015 | Aug 2018 | Apr 2019 | Dec 2019 | Dec 2021 | Jun 2024 | Jun 2026 |
| Trough | Aug 2015 | Dec 2018 | May 2019 | Mar 2020 | Sep 2022 | Apr 2025 | In progress |
| Depth | -17.2% | -19.9% | -15.5% | -17.2% | -40.1% | -19.0% | -23.1% |
| Months peak to trough | 3 | 4 | 1 | 3 | 9 | 10 | 1 |
| Months trough to new high | 11 | 4 | 2 | 3 | 10 | 2 | — |
Source: FactSet Global Prices. Peak, trough and recovery months are VanEck's identification at a 15% threshold. Past performance is not a guarantee of future results. Depth figures reflect SMH share price on a price-return basis. Recovery periods shown are historical and are not an indication of any future recovery. Please see important disclosures and definitions at the end of the commentary.
What Is $844 Billion a Year of AI Infrastructure Spending Buying?
The key distinction in the current AI cycle is between the capex level and the capex growth rate. The market is trading the growth rate. The companies supplying this build get paid on the level.
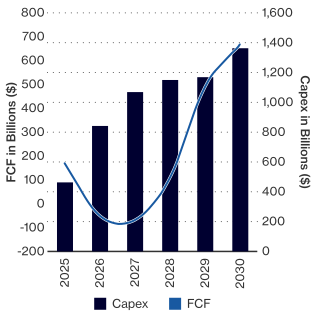
Capex for the five largest hyperscalers is predicted to climb to approximately $1.37 trillion by 2030. The growth rate decelerates sharply but never decreases. A hyperscaler spending $1.15 trillion a year and never growing that number still represents $1.15 trillion of annual demand for every company selling into it.
Free cash flow turns negative in 2026 and 2027 because capex growth is running ahead of operating cash flow growth. That gap closes mechanically in 2028 when capex growth comes back down with no demand change. Two negative years in the middle of the largest infrastructure build in corporate history is telling a story about timing rather than demand.
Capex Level Keeps Rising While FCF Recovers ($bn)
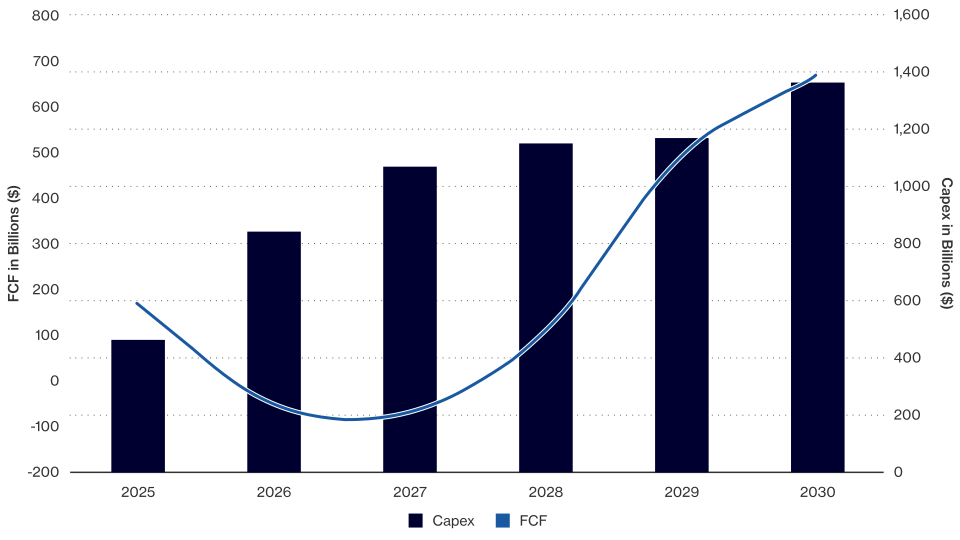
Source: FactSet Estimates, consensus mean CAPEX and CF_OP, for MSFT, GOOGL, AMZN, META and ORCL; estimate date August 7, 2026. Forecasts are subject to change and may not be realized. For illustrative purposes only
| 2025 | 2026E | 2027E | 2028E | 2029E | 2030E | |
| Capex ($bn) | 467 | 844 | 1,071 | 1,149 | 1,169 | 1,365 |
| Capex growth YoY | — | +81% | +27% | +7% | +2% | +17% |
| Operating cash flow ($bn) | 635 | 794 | 1,004 | 1,257 | 1,658 | 2,031 |
| Free cash flow ($bn) | 168 | (50) | (67) | 108 | 489 | 666 |
Source: FactSet Estimates, consensus mean, estimate date August 7, 2026. Forecasts are not guarantees of future results. For illustrative purposes only
How Far into the AI Deployment Cycle Are We, and What Drives Compute Demand From Here?
Most large organizations have touched AI. Very few have finished deploying it. 88% say they use AI somewhere, but only 6% have crossed McKinsey's threshold of meaningful earnings before interest and taxes (EBIT) impact. (Source: McKinsey & Company, “The State of AI in 2025: Agents, Innovation, and Transformation,” November 2025.) That gap between having AI somewhere and having it everywhere is the runway for compute demand.
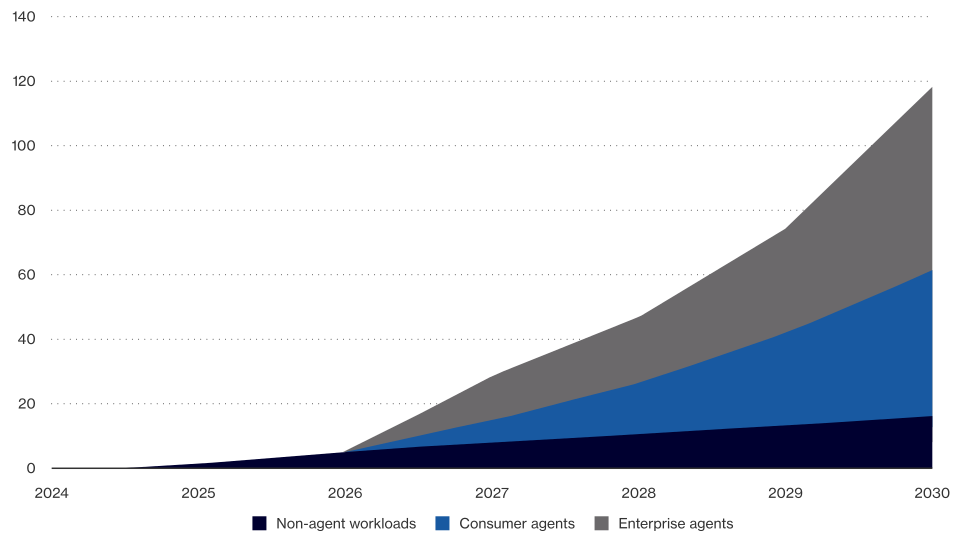
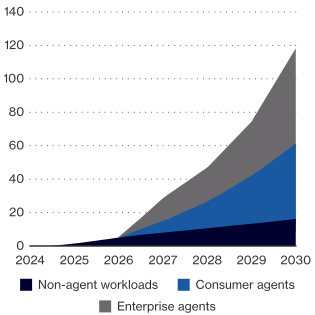
The internet analogy is useful here: by 2010, almost 72% of Americans were online, but only 4.2% of retail dollars had moved there. (Sources: NTIA, "Digital Nation: Expanding Internet Usage," February 2011; U.S. Census Bureau, "Quarterly Retail E-Commerce Sales, 4th Quarter 2010," February 2011.) ChatGPT launched in 2022, meaning we are only in year three of adoption. The next leg of compute demand is agents, software that plans, retrieves, attempts, and retries rather than answering once. One agentic task can consume hundreds of times the compute of a single chat, and Goldman Sachs Research forecasts token volume dominated by enterprise agent workloads from 2028 onward.
Predicted token growth by 2030
Source: Goldman Sachs Research, 'AI Agents Forecast to Boost Tech Cash Flow as Usage Soars,' May 20, 2026. Forecasts are subject to change and may not be realized. For illustrative purposes only.
Which Parts of the AI Supply Chain Benefit Most from Hyperscaler Spending?
The supply chain runs from chip design at the top, most sensitive to how fast spending grows, down to power infrastructure and data centers at the base, which get paid on the level regardless of the growth rate.
Why Chip Design Sits at the Top of the AI Spending Chain
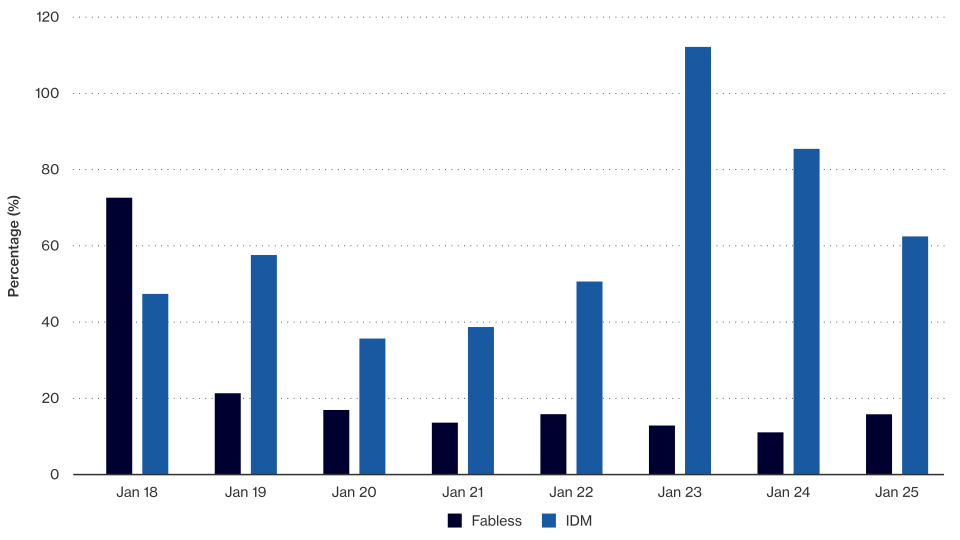
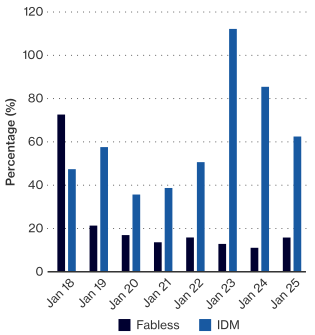
Fabless semiconductor companies design chips and outsource manufacturing to foundries like TSMC. Without fabs to maintain, they put capital into R&D and move faster as compute architecture evolves. NVIDIA is a prime example; they pivoted from gaming GPUs to a dominant AI training chip, made possible by the flexibility fabless design allows. The model covers both training and inference, including the custom silicon now being designed by Amazon, Google, Meta, and OpenAI.
SMHX, VanEck's fabless semiconductor ETF, provides pure-play exposure to this layer, excluding foundries, equipment makers, and vertically integrated manufacturers.
Capex to Operating Cash Flow
R&D Expenses to Sales
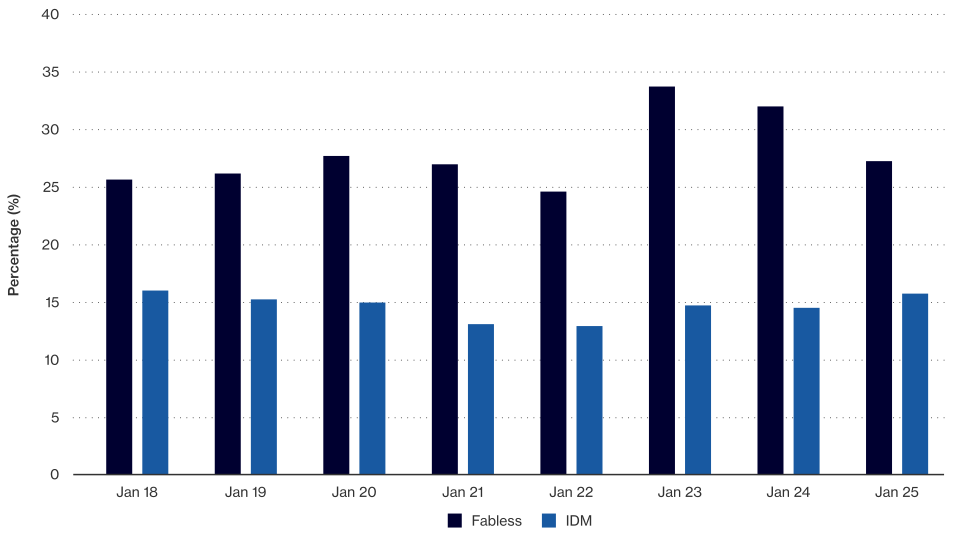
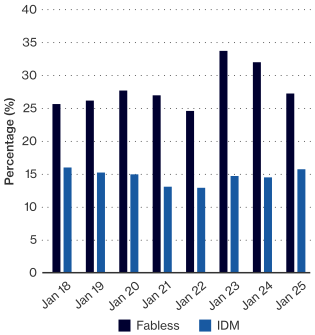
Source: MarketVector as of 2025. "Fabless" is the MarketVector™ US Listed Fabless Semiconductor Index (MVSMHX); "IDM" is a MarketVector-constructed set of companies classified by MarketVector as integrated device manufacturers. Past performance is not a guarantee of future results. Index performance is not illustrative of fund performance. It is not possible to invest directly in an index.
Why Every Layer of the Data Center Supply Chain Is Under Simultaneous Strain
Demand for chips, memory, cooling, and power is constrained at once, and each bottleneck carries multi-year order book visibility for the companies resolving it.
| Layer | What's Happening | Why It Matters |
| Semis / Chips & GPUs | Global semiconductor revenue approaching $1T in 2026; gen AI chips ~half of sales | AI's share of chip revenue grew from ~one-third in 2025 to ~half of 2026 projected sales |
| Memory / DRAM & HBM | Data centers set to use 70% of high-end DRAM production in 2026 | Memory chip shortage not expected to ease until 2028 |
| Cooling / Power & thermal | AI rack power density jumped from 5-15 kW to 100+ kW | Liquid cooling market expected to grow 20%+ annually through 2030 |
| Grid Infrastructure | Power transformers now take 2-4 years to deliver | 2-4 year equipment backlogs lock in demand through the decade |
Source: WSTS/SIA; Deloitte; Gartner; TrendForce; Bloomberg; Vertiv; Grand View Research; MarketsandMarkets; U.S. Department of Energy.
Power is the most durable of those constraints. US data center grid-power demand is projected to more than double from 62 GW in 2025 to 134 GW by 2030, and the grid is not built for it. Leading hyperscalers have signed nuclear agreements in the past 18 months because it is the only clean energy source that scales to data center load with minimal downtime.
US Data Center Power Demand (GW)
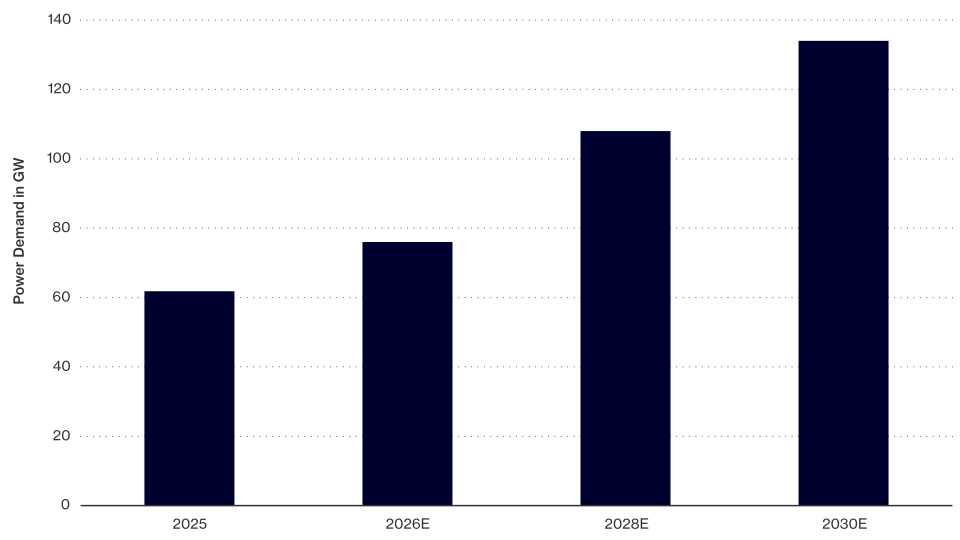
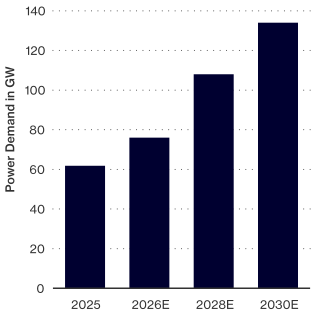
Source: S&P Global Commodity Insights / 451 Research; EPRI, Powering Intelligence (2026); U.S. Department of Energy; company announcements.
RACK, VanEck's data center supply chain ETF, spans this entire chain, from semiconductors and memory through cooling, power, and nuclear energy. It targets the companies the hyperscalers are spending with, not the hyperscalers themselves.
Recommended subscription
How Does Falling Robot Cost Connect to AI Deployment?
The cost of industrial robots has fallen dramatically over the past two decades, shifting adoption from a strategic consideration to an increasingly standard practice for many manufacturers. As AI moves from answering questions to completing workflows, a portion of that work happens in factories and warehouses. IBOT, VanEck's robotics ETF, captures this layer.
What Makes the Space Economy an Opportunity Independent of AI Capex?
Space sits off the hyperscaler capex chain by design. The Space Shuttle costs $54,500 per kilogram to reach orbit. Falcon 9 does it for under $2,720. (Source: NASA, "The Recent Large Reduction in Space Launch Cost,” 2020.) That cost reduction turned access to orbit from a government monopoly into a commercial industry. Space economy revenues are expected to triple by 2035. (Source: World Economic Forum and McKinsey & Company, "Space: The $1.8 Trillion Opportunity for Global Economic Growth," April 2024.) WARP, VanEck's pure-play space ETF, takes advantage of the growing space economy.
What Does a Decelerating AI Capex Growth Rate Mean for Investors?
The growth rate is going to come down. That hits the top of the supply chain hardest. But a slower growth rate is not the same as a cut. At 3% growth on $1.15 trillion, the spend is still above $1.15 trillion. No hyperscaler management team or analyst consensus is pointing to actual cuts.
The drawdown repriced multiples on a business whose earnings more than doubled and whose customers accelerated spending. The depth of AI deployment has barely started, the infrastructure supporting it is under strain at every layer, and the spending funding it is not going down. The growth rate is normalizing. The spend is not.
To receive more Thematic Investing insights, sign up in our subscription center.

IMPORTANT DISCLOSURES
This is not an offer to buy or sell, or a recommendation to buy or sell any of the securities, financial instruments or digital assets mentioned herein. The information presented does not involve the rendering of personalized investment, financial, legal, tax advice, or any call to action. Certain statements contained herein may constitute projections, forecasts and other forward-looking statements, which do not reflect actual results, are for illustrative purposes only, are valid as of the date of this communication, and are subject to change without notice. Actual future performance of any assets or industries mentioned are unknown. Information provided by third party sources are believed to be reliable and have not been independently verified for accuracy or completeness and cannot be guaranteed. VanEck does not guarantee the accuracy of third party data. The information herein represents the opinion of the author(s), but not necessarily those of VanEck or its other employees.
SMH Quarterly Standardized Performance (6/30/2026)
| Performance | 1 MO | 3 MO | YTD | 1 YR | 3 YR | 5 YR | 10 YR | LIFE 12/20/11 |
| SMH (NAV) | 9.66 | 71.30 | 82.30 | 136.07 | 63.45 | 38.86 | 38.12 | 31.17 |
| SMH (Market Price) | 9.51 | 71.07 | 82.13 | 135.90 | 63.44 | 38.81 | 38.10 | 31.14 |
| MVIS US Listed Semiconductor 25 Index | 9.69 | 71.48 | 82.59 | 136.75 | 63.81 | 39.11 | 38.25 | 31.22 |
Source: VanEck as of 6/30/2026.
*Returns less than one year are not annualized.
The performance data quoted represents past performance. Past performance is not a guarantee of future results. Investment return and principal value of an investment will fluctuate so that an investor's shares, when redeemed, may be worth more or less than their original cost. Performance may be lower or higher than performance data quoted. Please call 800.826.2333 or visit vaneck.com for performance current to the most recent month ended.
SMH Gross Expense Ratio – 0.35%
MVIS® US Listed Semiconductor 25 Index (MVSMHTR) is intended to track the overall performance of companies involved in semiconductor production and equipment.
MarketVector™ US Listed Fabless Semiconductor Index (the “Fabless Index” or the “Index”) is intended to track the overall performance of companies involved in semiconductor production and classified as a fabless.
Definitions - Drawdown is the decline in share price from a prior closing peak to the lowest subsequent close, and depth is that peak-to-trough decline expressed as a percentage. Median completed drawdown is the middle depth of drawdowns that recovered to a new closing high and excludes periods still in progress; a decline shown as in progress has not reached a confirmed trough, so its duration and recovery are not yet determinable. Price return reflects share price change only, excluding dividends and the deduction of fees, expenses and sales charges. Capex, or capital expenditure, is spending on property, plant and equipment, and free cash flow is operating cash flow less capital expenditure. A fabless semiconductor company designs chips and outsources manufacturing to third-party foundries, while an integrated device manufacturer (IDM) both designs and fabricates its own chips.
Fund holdings will vary and are subject to change. For a complete list of fund holdings, please visit vaneck.com.
An investment in the VanEck Semiconductor ETF (SMH) and VanEck Fabless Semiconductor ETF (SMHX) may be subject to risks which include, among others, risks related to investing in the semiconductor industry, special risk considerations of investing in Taiwanese issuers, equity securities, small-, medium and large-capitalization companies, foreign securities, emerging market issuers, foreign currency, depositary receipts, issuer-specific changes, market, operational, index tracking, authorized participant concentration, new fund, no guarantee of active trading market, trading issues, passive management, fund shares trading, premium/discount and liquidity of fund shares, non-diversified, and index-related concentration risks, all of which may adversely affect the Fund. Small, medium and large-capitalization companies may be subject to elevated risks. Emerging market issuers and foreign securities may be subject to securities markets, political and economic, investment and repatriation restrictions, different rules and regulations, less publicly available financial information, foreign currency and exchange rates, operational and settlement, and corporate and securities laws risks.
An investment in the VanEck Data Center Supply Chain ETF (RACK) may be subject to risks which include, but are not limited to, risks related to investments in Data Center Supply Chain Companies, communication services sector, industrials sector, information technology sector, equity securities, depositary receipts, REITs, small-, medium-, and large-capitalization companies, market, operational, index tracking, authorized participant concentration, new fund, no guarantee of active trading market, trading issues, passive management, fund shares trading, premium/discount, liquidity of fund shares, non-diversified, index-related concentration and issuer-specific changes risks, all of which may adversely affect the Fund. Small-, medium-, and large-capitalization companies may be subject to elevated risks.
An investment in the VanEck Robotics ETF (IBOT) may be subject to risks which include, among others, risks related to investing in robotics companies, information technology sector, industrials sector, equity securities, medium-capitalization companies, special risk considerations of investing in Japanese and European issuers, foreign securities, semiconductor industry, depositary receipts, market, operational, index tracking, authorized participant concentration, no guarantee of active trading market, trading issues, passive management, fund shares trading, premium/discount and liquidity of fund shares, non-diversified and index-related concentration risks, all of which may adversely affect the Fund. Medium-capitalization companies may be subject to elevated risks.
An investment in the VanEck Space ETF (WARP) may be subject to risks which include, but are not limited to, risks related to investments in Space Companies, foreign securities, foreign currency, depositary receipts, communication services sector, industrials sector, small-, medium-, and large-capitalization companies, equity securities, market, operational, index tracking, authorized participant concentration, new fund, no guarantee of active trading market, trading issues, passive management, fund shares trading, premium/discount risk and liquidity of fund shares, non-diversified and index-related concentration risks, all of which may adversely affect the Fund. Foreign securities may be subject to securities markets, political and economic, investment and repatriation restrictions, different rules and regulations, less publicly available financial information, foreign currency and exchange rates, operational and settlement, and corporate and securities laws risks. Small- and medium-capitalization companies may be subject to elevated risks.
Investing involves substantial risk and high volatility, including possible loss of principal. An investor should consider the investment objective, risks, charges and expenses of a Fund carefully before investing. To obtain a prospectus and summary prospectus, which contain this and other information, call 800.826.2333 or visit vaneck.com. Please read the prospectus and summary prospectus carefully before investing.
© 2026 Van Eck Securities Corporation, Distributor, a wholly owned subsidiary of Van Eck Associates Corporation. 666 Third Avenue, New York, NY 10017.
Related Funds
IMPORTANT DISCLOSURES
This is not an offer to buy or sell, or a recommendation to buy or sell any of the securities, financial instruments or digital assets mentioned herein. The information presented does not involve the rendering of personalized investment, financial, legal, tax advice, or any call to action. Certain statements contained herein may constitute projections, forecasts and other forward-looking statements, which do not reflect actual results, are for illustrative purposes only, are valid as of the date of this communication, and are subject to change without notice. Actual future performance of any assets or industries mentioned are unknown. Information provided by third party sources are believed to be reliable and have not been independently verified for accuracy or completeness and cannot be guaranteed. VanEck does not guarantee the accuracy of third party data. The information herein represents the opinion of the author(s), but not necessarily those of VanEck or its other employees.
SMH Quarterly Standardized Performance (6/30/2026)
| Performance | 1 MO | 3 MO | YTD | 1 YR | 3 YR | 5 YR | 10 YR | LIFE 12/20/11 |
| SMH (NAV) | 9.66 | 71.30 | 82.30 | 136.07 | 63.45 | 38.86 | 38.12 | 31.17 |
| SMH (Market Price) | 9.51 | 71.07 | 82.13 | 135.90 | 63.44 | 38.81 | 38.10 | 31.14 |
| MVIS US Listed Semiconductor 25 Index | 9.69 | 71.48 | 82.59 | 136.75 | 63.81 | 39.11 | 38.25 | 31.22 |
Source: VanEck as of 6/30/2026.
*Returns less than one year are not annualized.
The performance data quoted represents past performance. Past performance is not a guarantee of future results. Investment return and principal value of an investment will fluctuate so that an investor's shares, when redeemed, may be worth more or less than their original cost. Performance may be lower or higher than performance data quoted. Please call 800.826.2333 or visit vaneck.com for performance current to the most recent month ended.
SMH Gross Expense Ratio – 0.35%
MVIS® US Listed Semiconductor 25 Index (MVSMHTR) is intended to track the overall performance of companies involved in semiconductor production and equipment.
MarketVector™ US Listed Fabless Semiconductor Index (the “Fabless Index” or the “Index”) is intended to track the overall performance of companies involved in semiconductor production and classified as a fabless.
Definitions - Drawdown is the decline in share price from a prior closing peak to the lowest subsequent close, and depth is that peak-to-trough decline expressed as a percentage. Median completed drawdown is the middle depth of drawdowns that recovered to a new closing high and excludes periods still in progress; a decline shown as in progress has not reached a confirmed trough, so its duration and recovery are not yet determinable. Price return reflects share price change only, excluding dividends and the deduction of fees, expenses and sales charges. Capex, or capital expenditure, is spending on property, plant and equipment, and free cash flow is operating cash flow less capital expenditure. A fabless semiconductor company designs chips and outsources manufacturing to third-party foundries, while an integrated device manufacturer (IDM) both designs and fabricates its own chips.
Fund holdings will vary and are subject to change. For a complete list of fund holdings, please visit vaneck.com.
An investment in the VanEck Semiconductor ETF (SMH) and VanEck Fabless Semiconductor ETF (SMHX) may be subject to risks which include, among others, risks related to investing in the semiconductor industry, special risk considerations of investing in Taiwanese issuers, equity securities, small-, medium and large-capitalization companies, foreign securities, emerging market issuers, foreign currency, depositary receipts, issuer-specific changes, market, operational, index tracking, authorized participant concentration, new fund, no guarantee of active trading market, trading issues, passive management, fund shares trading, premium/discount and liquidity of fund shares, non-diversified, and index-related concentration risks, all of which may adversely affect the Fund. Small, medium and large-capitalization companies may be subject to elevated risks. Emerging market issuers and foreign securities may be subject to securities markets, political and economic, investment and repatriation restrictions, different rules and regulations, less publicly available financial information, foreign currency and exchange rates, operational and settlement, and corporate and securities laws risks.
An investment in the VanEck Data Center Supply Chain ETF (RACK) may be subject to risks which include, but are not limited to, risks related to investments in Data Center Supply Chain Companies, communication services sector, industrials sector, information technology sector, equity securities, depositary receipts, REITs, small-, medium-, and large-capitalization companies, market, operational, index tracking, authorized participant concentration, new fund, no guarantee of active trading market, trading issues, passive management, fund shares trading, premium/discount, liquidity of fund shares, non-diversified, index-related concentration and issuer-specific changes risks, all of which may adversely affect the Fund. Small-, medium-, and large-capitalization companies may be subject to elevated risks.
An investment in the VanEck Robotics ETF (IBOT) may be subject to risks which include, among others, risks related to investing in robotics companies, information technology sector, industrials sector, equity securities, medium-capitalization companies, special risk considerations of investing in Japanese and European issuers, foreign securities, semiconductor industry, depositary receipts, market, operational, index tracking, authorized participant concentration, no guarantee of active trading market, trading issues, passive management, fund shares trading, premium/discount and liquidity of fund shares, non-diversified and index-related concentration risks, all of which may adversely affect the Fund. Medium-capitalization companies may be subject to elevated risks.
An investment in the VanEck Space ETF (WARP) may be subject to risks which include, but are not limited to, risks related to investments in Space Companies, foreign securities, foreign currency, depositary receipts, communication services sector, industrials sector, small-, medium-, and large-capitalization companies, equity securities, market, operational, index tracking, authorized participant concentration, new fund, no guarantee of active trading market, trading issues, passive management, fund shares trading, premium/discount risk and liquidity of fund shares, non-diversified and index-related concentration risks, all of which may adversely affect the Fund. Foreign securities may be subject to securities markets, political and economic, investment and repatriation restrictions, different rules and regulations, less publicly available financial information, foreign currency and exchange rates, operational and settlement, and corporate and securities laws risks. Small- and medium-capitalization companies may be subject to elevated risks.
Investing involves substantial risk and high volatility, including possible loss of principal. An investor should consider the investment objective, risks, charges and expenses of a Fund carefully before investing. To obtain a prospectus and summary prospectus, which contain this and other information, call 800.826.2333 or visit vaneck.com. Please read the prospectus and summary prospectus carefully before investing.
© 2026 Van Eck Securities Corporation, Distributor, a wholly owned subsidiary of Van Eck Associates Corporation. 666 Third Avenue, New York, NY 10017.