Physical AI: Robotics Heading Into 2027
November 04, 2026
Read Time 10 MIN
Key Takeaways
- More Than Chips: IBOT owns the whole robot, with about three-quarters of the fund outside chips and chip equipment.
- Builders Are Betting: NVIDIA's top two bets are AI and robotics; Fanuc (2.61% of IBOT) shipped 1,000+ AI robots.
- Fleet at a Record: 603,000 robots were installed in 2025, up 11%, and the IFR sees 806,000 in 2029.
- Labor and Reshoring Help: U.S. manufacturers may need 3.8M workers by 2033, and the U.S. is the No. 2 robot market.
- Strong Results, Low Cost: IBOT returned 29.76% (NAV) in one year vs. a 12.10% peer median, at a 0.47% expense ratio.
Please click here for IBOT standardized performance.
AI is moving into the physical world
The first wave of artificial intelligence was built in data centers: chips, servers and the software that runs on them. The next wave takes that intelligence off the screen and into machines. This is physical AI: robots that can see their surroundings, learn new tasks and work next to people in manufacturing, logistics, warehousing and agriculture. It is the same AI buildout, moving into the real economy.
The clearest signal comes from the companies building the technology. NVIDIA CEO Jensen Huang has called AI and robotics the company's two largest opportunities, representing a "multitrillion-dollar growth opportunity." Fanuc, one of the world's largest robot makers and a 2.61% IBOT holding, is already acting on it. Since December 2025 it has shipped more than 1,000 robots built for physical AI, using NVIDIA's simulation and on-robot computing platforms.
Capital is following. Robotics startups raised $18.8 billion in the first half of 2026, compared with $15 billion in all of 2025, according to Crunchbase. PitchBook counted $18.6 billion across 450 robotics and physical AI deals in the second quarter alone.
Forecasters are starting to size the prize. In a September 2026 report, Goldman Sachs Research expects humanoid robot shipments to rise from about 75,000 units in 2026 to 890,000 by 2030 and 6.5 million by 2035, a market it values at roughly $138 billion, up from its earlier estimate of $38 billion. Other forecasts are more cautious: Interact Analysis projects about $15 billion of humanoid hardware revenue in 2035. The range is wide, but both point to strong growth. IBOT is not a humanoid fund, so these figures show the scale of the physical AI opportunity, not the fund's revenue.
The installed base gives this wave a large foundation. More than 5 million industrial robots now operate worldwide, more than double the number seven years ago. Every one of them needs software, sensors, service and, increasingly, AI upgrades.
Chart 1 — Global robot installations hit a record in 2025, and the IFR expects more growth
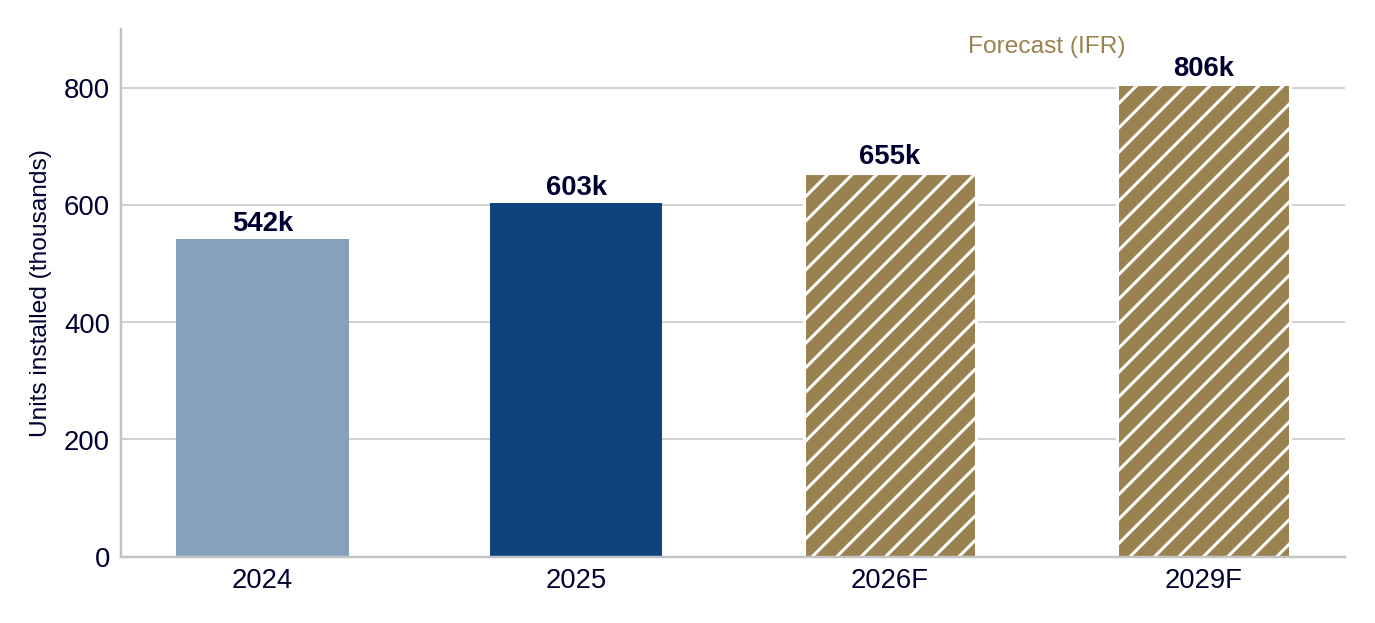
Source: International Federation of Robotics, World Robotics 2026 (released September 24, 2026) and World Robotics 2025 (2024 figure). Annual installations of industrial robots, thousands of units. 2026 and 2029 are IFR forecasts. Forecasts are not guarantees of future results.
Why 2027: labor, reshoring and smarter robots
Three forces support robot demand heading into 2027. The first is labor. Deloitte and The Manufacturing Institute estimate U.S. manufacturers will need 3.8 million workers between 2024 and 2033, and as many as 1.9 million of those jobs could go unfilled. U.S. manufacturing job openings still stood at 522,000 in August 2026, according to the Bureau of Labor Statistics.
The second is reshoring. U.S. robot installations rose 12% in 2025 to about 38,500 units, making the U.S. the world's second-largest market, ahead of Japan. China remains the largest by far, with 354,000 installations, or 59% of the global total. In North America, robot orders reached 17,995 units worth $1.17 billion in the first half of 2026, according to the Association for Advancing Automation (A3), and second-quarter order value rose 21%. A3 notes that demand is broadening beyond the auto industry.
The third is cost. AI and machine vision are making robots easier to program and faster to deploy, which opens automation to smaller factories and new tasks. Humanoid robots are getting attention as well: 2026 has been a year of pilots, and the first deployments with outside customers are expected in 2027. IBOT is not a dedicated humanoid fund. It owns the established companies that supply motion control, vision and software to robots of every shape, along with humanoid maker UBTech.
Owning the full robot value chain
A robot is a system. It needs a body (arms, actuators and drives), eyes (cameras and sensors), a design and simulation layer (software) and a brain (chips). IBOT tracks the BlueStar Robotics Index, which holds companies across each of these links. To qualify, a company must earn at least 50% of its revenue from robotics and automation, so the portfolio stays focused on pure-play businesses.
Chart 2 — IBOT spans every part of the robot

Source: VanEck, as of 10/28/2026. Groups are VanEck classifications based on GICS sub-industry: robots, automation & machinery = industrial machinery, electrical components and subsea robotics/equipment; machine vision, sensors & instruments = electronic equipment, instruments and components; chips & chip equipment = semiconductors and semiconductor equipment; design & simulation software = application software and IT services; surgical robotics = Intuitive Surgical. Holdings are subject to change.
Recommended subscription
Who buys what IBOT's companies make
A fund's holdings are only as strong as their customers' spending, so it helps to know who is buying. IBOT's companies sell mostly to other businesses, and five customer groups stand out.
Table 1 — Who buys what IBOT's companies make
| Customer group | What they buy | Example IBOT holdings |
| Electronics makers | Robots, machine vision, sensors | Fanuc, Keyence |
| Automakers and EV suppliers | Welding, assembly and battery-line robots, controls | Fanuc, ABB, Rockwell Automation |
| Metal, machinery and general industry | Robots, controls, design software | Autodesk, Rockwell Automation |
| Energy and process industries | Control systems, valves, measurement, subsea systems | Emerson Electric, Rockwell Automation, TechnipFMC |
| Food, logistics and healthcare | Flexible automation, material handling, surgical robots | Daifuku, Intuitive Surgical |
Source: VanEck, as of 10/28/2026. Example holdings are VanEck's illustrative mapping of each company's main customers, not a complete list. Holdings are subject to change and are not recommendations to buy or sell any security.
- Electronics makers. Electronics is the largest customer industry for robots in China, which installed 96,400 in 2025, up 16%, according to the IFR. Robots, sensors and machine vision are used to assemble and inspect phones, circuit boards and other devices.
- Automakers and EV suppliers. Autos remain a core customer. China's auto industry installed a record 78,900 robots in 2025, up 38%, while U.S. automakers installed 13,500, about 1% fewer. Autos remain the largest U.S. customer industry. Auto demand is cyclical, and the picture differs by region.
- Metal, machinery and general industry. China's metal and machinery industry installed 78,700 robots in 2025, up 44%. The IFR notes that the center of gravity of robotics has shifted from automotive toward general industry, where demand has quintupled over the past decade.
- Energy and process industries. Oil and gas operators and the firms that serve them buy control systems, valves and measurement equipment, and TechnipFMC, a 2.42% holding, sells subsea systems to energy producers. These customers follow energy investment cycles rather than AI spending, so they add demand from outside the AI cycle, which is part of what diversifies the fund.
- Food, logistics and healthcare. Newer customers are smaller but growing. U.S. food industry installations rose 30% in 2025, to about 2,900 units, as manufacturers looked for flexible automation. Intuitive Surgical, about 1% of IBOT, sells surgical robots to hospitals.
Customer breadth is a strength of the portfolio. Electronics, autos, energy, machinery and healthcare each run on different spending cycles, so no single industry drives all of IBOT's demand. Autos and electronics remain cyclical, and a broad pullback in factory investment would reach most of the portfolio.
A global portfolio, built where the robots are
Much of the world's robotics industry sits outside the U.S. Japan is home to leading robot and motion-control makers such as Fanuc, Yaskawa, Keyence and Daifuku. Europe adds ABB, Hexagon, Dassault Systèmes and ASML. As a result, about 57% of IBOT is invested outside the U.S. (23% Japan, 32% Europe), and about 29% is in mid-cap companies. For investors whose AI exposure is concentrated in U.S. mega-cap technology stocks, IBOT adds a different set of companies, countries and currencies tied to the same AI theme.
Customers are global as well, and their cycles differ. In 2025, China's installations rose 20%, and U.S. installations rose 12% to about 38,500. Japan fell 19% to 36,219, and the EU fell 11% to 60,500, according to the IFR. IBOT holds companies based in the U.S., Japan and Europe, so a slowdown in one region does not have to set the course for the whole portfolio.
Chart 3 — More than half of IBOT is invested outside the U.S.

Source: VanEck, as of 10/28/2026. Country of risk. Europe includes the U.K., Switzerland and Norway. Other includes China, Canada and Israel. Holdings are subject to change.
Performance and cost
Over the year ended September 30, 2026, IBOT returned 29.76% at NAV, compared with a 12.10% median for robotics ETF peers. Over three years, it returned 24.56% annualized against a 17.23% peer median, and its largest drawdown over that period (-12.19%) was the smallest in the group. IBOT's 0.47% expense ratio is 25 basis points below the peer median.
Table 2 — IBOT average annual total returns (%) as of 9/30/2026
| 3 Mo | YTD | 1 Yr | 3 Yr | Life (4/5/2023) | |
| IBOT (NAV) | -6.12 | 22.85 | 29.76 | 24.56 | 21.54 |
| IBOT (Market Price) | -6.11 | 22.64 | 29.79 | 24.52 | 21.58 |
| BlueStar Robotics Index | -5.47 | 23.26 | 30.47 | 24.98 | 22.01 |
Source: VanEck (fund and index returns) and Morningstar (peer medians cited in the text), as of 9/30/2026. Returns less than one year are not annualized. Expense ratio: 0.47% (gross and net). Peer medians cited in the text reflect robotics ETFs in IBOT's peer group (BOTZ, ROBO, CHAT, ARKQ, ROBT, KOID, BOTT and IBOT); 3-year median reflects funds with a 3-year record. The performance data quoted represents past performance. Past performance is no guarantee of future results. Investment return and principal value will fluctuate so that shares, when redeemed, may be worth more or less than their original cost.
Table 3 — IBOT vs. robotics ETF peers: key differences (NAV, as of 9/30/2026)
| Fund | Type and index / strategy | Inception date | 1 Yr | 3 Yr | 5 Yr | 10 Yr | Since inception | Expense ratio, gross / net |
| VanEck Robotics ETF (IBOT) | Passive: BlueStar Robotics Index | 4/5/2023 | 29.76 | 24.56 | N/A | N/A | 21.54 | 0.47 / 0.47 |
| Global X Robotics & Artificial Intelligence ETF (BOTZ) | Passive: Indxx Global Robotics & Artificial Intelligence Thematic Index | 9/12/2016 | 0.06 | 12.93 | -0.47 | 9.27 | 9.47 | 0.68 / 0.68 |
| ROBO Global Robotics & Automation ETF (ROBO) | Passive: ROBO Global Robotics and Automation Index | 10/22/2013 | 23.09 | 17.23 | 4.72 | 11.29 | 9.69 | 0.95 / 0.95 |
| Roundhill Generative AI & Technology ETF (CHAT) | Active: global companies involved in artificial intelligence, focused on generative AI | 5/17/2023 | 54.08 | 51.85 | N/A | N/A | 47.82 | 0.75 / 0.75 |
| ARK Autonomous Technology & Robotics ETF (ARKQ) | Active: autonomous technology and robotics companies | 9/30/2014 | 8.96 | 32.28 | 9.59 | 19.25 | 17.07 | 0.75 / 0.75 |
| First Trust Nasdaq Artificial Intelligence and Robotics ETF (ROBT) | Passive: Nasdaq CTA Artificial Intelligence and Robotics Index | 2/21/2018 | 12.10 | 13.85 | 2.37 | N/A | 8.55 | 0.65 / 0.65 |
| KraneShares Global Humanoid Robotics & Physical AI Index ETF (KOID) | Passive: MerQube Global Humanoid and Embodied Intelligence Index | 6/4/2025 | 13.88 | N/A | N/A | N/A | 32.85 | 0.79 / 0.69 |
| Themes Humanoid Robotics ETF (BOTT) | Passive: Solactive Industrial Robotics & Automation Index | 4/19/2024 | 5.43 | N/A | N/A | N/A | 24.28 | 0.35 / 0.35 |
| Peer median (excluding IBOT) | — | — | 12.10 | 17.23 | — | — | — | — |
Source: VanEck (IBOT) and Morningstar (all other funds), as of 9/30/2026. Returns are NAV average annual total returns (%). Returns for periods less than one year are not annualized. N/A = fund did not exist for the full period. Fund type, inception dates and prospectus gross/net expense ratios are from Morningstar and each fund's prospectus; IBOT's objective is from vaneck.com. Peer returns were calculated by VanEck from Morningstar monthly NAV total returns. The peer median covers the seven peers shown (IBOT excluded); the 3-year median covers the five peers with a 3-year record. KOID's net expense ratio reflects a fee waiver; see the fund's prospectus for the terms and expiration of the waiver. Funds shown are the robotics ETF peer group referenced in this blog. They differ from IBOT in investment objective, index or active strategy, holdings, fees and risks, and are not intended to be identical to IBOT. Passive = seeks to track an index; Active = actively managed. The performance data quoted represents past performance. Past performance is not a guarantee of future results. Investment return and principal value of an investment will fluctuate so that an investor's shares, when redeemed, may be worth more or less than their original cost. Performance may be lower or higher than performance data quoted. Please call 800.826.2333 or visit vaneck.com for performance current to the most recent month ended.
Accessing robotics with IBOT
IBOT can play several roles in a portfolio:
- A different kind of AI exposure. IBOT's holdings build and run robots rather than make chips, which gives the fund different drivers than a semiconductor fund.
- A diversifier for 2027 AI allocations. IBOT adds global and mid-cap exposure to AI portfolios that lean heavily on U.S. mega-cap technology stocks.
- An answer to humanoid questions. Rather than betting on which humanoid design wins, IBOT owns established companies that supply the industry today.
Table 4 — IBOT at a glance
| VanEck Robotics ETF | |
| Ticker | IBOT |
| Index | BlueStar Robotics Index |
| Expense ratio | 0.47% |
| Inception date | 4/5/2023 |
| Number of holdings | 65 |
| Total net assets | $101.55 million (9/30/2026) |
| Rebalance | Semiannual (June and December) |
Source: VanEck, as of 9/30/2026. Rebalance schedule per the BlueStar Robotics Index methodology (MarketVector Indexes).
Conclusion
Physical AI is a newer part of the AI story than chips and data centers, and it reaches further into the real economy. IBOT's holdings build and run the machines that carry AI into factories, warehouses and hospitals. They sell to customers across many industries and operate in many countries, which spreads exposure more widely than a single-theme AI holding. As with any thematic fund, results can be volatile.
IBOT | VanEck Robotics ETF

IMPORTANT DISCLOSURES
This is not an offer to buy or sell, or a recommendation to buy or sell any of the securities, financial instruments or digital assets mentioned herein. The information presented does not involve the rendering of personalized investment, financial, legal, tax advice, or any call to action. Certain statements contained herein may constitute projections, forecasts and other forward-looking statements, which do not reflect actual results, are for illustrative purposes only, are valid as of the date of this communication, and are subject to change without notice. Actual future performance of any assets or industries mentioned are unknown. Information provided by third party sources are believed to be reliable and have not been independently verified for accuracy or completeness and cannot be guaranteed. VanEck does not guarantee the accuracy of third party data. The information herein represents the opinion of the author(s), but not necessarily those of VanEck or its other employees.
Holdings and allocations are subject to change. References to specific securities are for illustrative purposes only and are not recommendations to buy or sell any security.
The BlueStar Robotics Index tracks the performance of companies that are involved in robotics. Indexes are unmanaged and are not available for direct investment; their results do not reflect fees or expenses. MarketVector Indexes GmbH is the index business of VanEck. MarketVector Indexes does not sponsor, endorse, sell, promote or manage any investment fund or other investment vehicle that is offered by third parties and that seeks to provide an investment return based on the performance of any index, and makes no assurance that investment products based on the index will accurately track index performance or provide positive investment returns.
An investment in the Fund may be subject to risks which include, among others, investing in the robotics industry, information technology sector, industrials sector, equity securities, medium-capitalization companies, Japanese issuers, foreign securities, semiconductor industry, depositary receipts, market, operational, index tracking, authorized participant concentration, no guarantee of active trading market, trading issues, passive management, fund shares trading, premium/discount and liquidity of fund shares, non-diversified and concentration risk, all of which may adversely affect the Fund. Medium-capitalization companies may be subject to elevated risks.
Investing involves substantial risk and high volatility, including possible loss of principal. An investor should consider the investment objective, risks, charges and expenses of a Fund carefully before investing. To obtain a prospectus and summary prospectus, which contain this and other information, call 800.826.2333 or visit vaneck.com. Please read the prospectus and summary prospectus carefully before investing.
© Van Eck Securities Corporation, Distributor, a wholly owned subsidiary of Van Eck Associates Corporation. 666 Third Avenue | New York, NY 10017. © 2026 VanEck. VanEck® and the stylized VanEck design® are trademarks of Van Eck Associates Corporation.
Related Funds
IMPORTANT DISCLOSURES
This is not an offer to buy or sell, or a recommendation to buy or sell any of the securities, financial instruments or digital assets mentioned herein. The information presented does not involve the rendering of personalized investment, financial, legal, tax advice, or any call to action. Certain statements contained herein may constitute projections, forecasts and other forward-looking statements, which do not reflect actual results, are for illustrative purposes only, are valid as of the date of this communication, and are subject to change without notice. Actual future performance of any assets or industries mentioned are unknown. Information provided by third party sources are believed to be reliable and have not been independently verified for accuracy or completeness and cannot be guaranteed. VanEck does not guarantee the accuracy of third party data. The information herein represents the opinion of the author(s), but not necessarily those of VanEck or its other employees.
Holdings and allocations are subject to change. References to specific securities are for illustrative purposes only and are not recommendations to buy or sell any security.
The BlueStar Robotics Index tracks the performance of companies that are involved in robotics. Indexes are unmanaged and are not available for direct investment; their results do not reflect fees or expenses. MarketVector Indexes GmbH is the index business of VanEck. MarketVector Indexes does not sponsor, endorse, sell, promote or manage any investment fund or other investment vehicle that is offered by third parties and that seeks to provide an investment return based on the performance of any index, and makes no assurance that investment products based on the index will accurately track index performance or provide positive investment returns.
An investment in the Fund may be subject to risks which include, among others, investing in the robotics industry, information technology sector, industrials sector, equity securities, medium-capitalization companies, Japanese issuers, foreign securities, semiconductor industry, depositary receipts, market, operational, index tracking, authorized participant concentration, no guarantee of active trading market, trading issues, passive management, fund shares trading, premium/discount and liquidity of fund shares, non-diversified and concentration risk, all of which may adversely affect the Fund. Medium-capitalization companies may be subject to elevated risks.
Investing involves substantial risk and high volatility, including possible loss of principal. An investor should consider the investment objective, risks, charges and expenses of a Fund carefully before investing. To obtain a prospectus and summary prospectus, which contain this and other information, call 800.826.2333 or visit vaneck.com. Please read the prospectus and summary prospectus carefully before investing.
© Van Eck Securities Corporation, Distributor, a wholly owned subsidiary of Van Eck Associates Corporation. 666 Third Avenue | New York, NY 10017. © 2026 VanEck. VanEck® and the stylized VanEck design® are trademarks of Van Eck Associates Corporation.