Gold Miners: The Opportunity Behind the Volatility
November 10, 2026
Read Time 8 MIN
Key Takeaways
- Gold miners outperformed during the rally and recent sideways market but fell harder during the sell-off.
- Strong margins and balance sheets underpin the investment case despite share price volatility.
- A steadier gold price could bring business fundamentals into focus; costs and execution remain key risks.
Gold fell $282.79 an ounce, or 6.80%, in October and closed the month at $3,874.62. The gold mining stocks, as represented by the MarketVector Global Gold Miners Index (MVGDXTR)1, fell 11.88% over the same period. Even so, gold averaged $4,107 an ounce in October and has averaged about $4,500 so far in 2026; a healthy level for producers, whose reserves and project economics are built on prices well below it. What has changed this year is the ride. Annualized realized volatility in gold is around 29% in 2026, nearly double the average of about 15% over the prior five years (2021–2025).
Source: World Gold Council, as of October 2026.
Gold Miners: The Opportunity Behind the Volatility
How Gold Mining Stocks Responded to Gold Prices
Gold mining stocks showed greater sensitivity to gold’s moves in both directions this year, then held up during the recent sideways period. That makes 2026 a useful test of how the sector behaves across different gold price environments. Gold has had three phases this year: a sharp rally into late January, a sell-off that deepened after the war in Iran began, and a sideways market around $4,000 an ounce since the summer. The question gold equity investors ask us most is how sensitive mining stocks really are to changes in the gold price. This year's answer has some nuance, and we think it points back to the strength of the businesses behind the stocks.
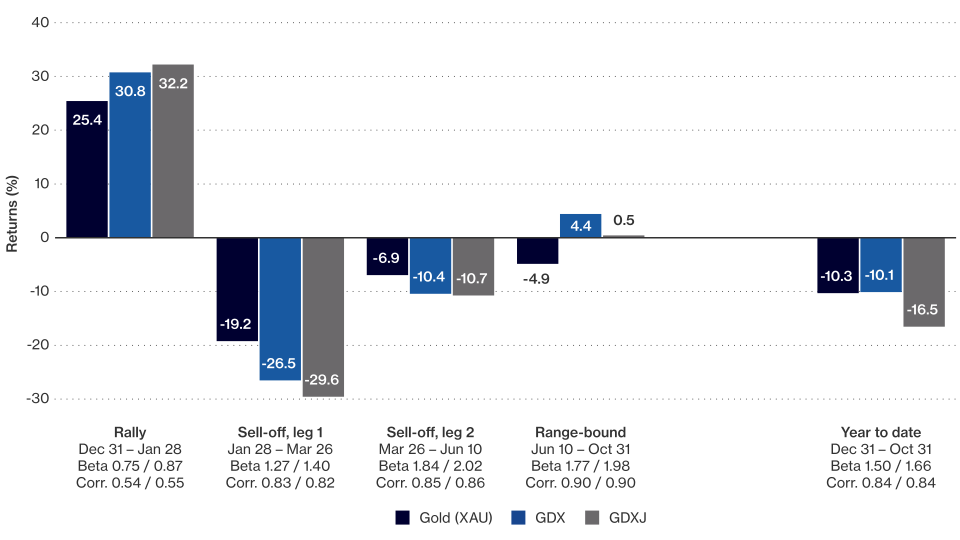
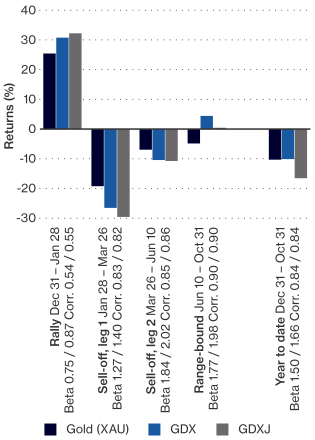
Miners beat gold in the rally, lagged in both legs of the sell-off, and beat it again once gold stopped falling.
Return over each period, then year to date. Gold is XAU spot (price return); GDX and GDXJ are total return. Beta and correlation are measured against gold (XAU) over each period, shown as GDX / GDXJ.
Source: VanEck and Bloomberg. Data as of 10/31/2026. GDX: VanEck Gold Miners ETF; GDXJ: VanEck Junior Gold Miners ETF. Returns for periods less than one year are not annualized.
Click here for GDX Standardized Performance
Click here for GDXJ Standardized Performance
Past performance is no guarantee of future results. Investment return and principal value will fluctuate; shares may be worth more or less than original cost when redeemed. Current performance may be lower or higher. Call 800.826.2333 or visit vaneck.com for month-end performance.
In the chart above, the rally ends at the January 28 gold peak. We split the sell-off at March 26, where its steepest leg ended.
Here, beta measures how sensitive mining stock returns were to daily changes in the gold price over each period.
Investors often ask how closely gold stocks follow gold, and the answer is very closely. Over 2026 the correlation of both GDX and GDXJ with gold was 0.84, and in each of the last three periods it was between 0.82 and 0.90. A correlation of 0.84 means gold explains roughly 70% of the day-to-day moves in the miners, with the rest coming from equity markets and company-specific news. The January rally is the exception, at about 0.55, but that period covered fewer than 20 trading days, which is a short window that makes the estimate less reliable.
Gold Miners Across Four Market Scenarios
Earlier this year we outlined three gold scenarios for miners: rising gold, range-bound gold and a gold pullback. We did not include a steep sell-off among our original scenarios but have now included it in our revised exhibit below.
- Rising gold (Dec 31 – Jan 28): Miners outperformed as the scenario expected, though by a relatively modest margin for such a sharp move in gold.
- Steep sell-off (Jan 28 – Jun 10, in two legs): This was not the pullback scenario we originally considered. It was a deeper sell-off, and it was too much for miners to absorb. They fell more than gold, and the resilience we expected from strong margins did not show up in share prices.
- Range-bound (Jun 10 – Oct 31): This is where the case for miners showed up. With gold drifting lower, gold equities still rose, consistent with the re-rating scenario we described.
- Pullback (year to date, Dec 31 – Oct 31): Taken as a whole, the year looks much more like the pullback we had in mind. Larger producers have held up about as well as the metal, which is the resilience we described. Smaller-cap companies have lagged, but this isn’t too surprising, as they don’t enjoy many of the senior and mid-tier producers' advantages (plenty of liquidity; diversified sources (or even a source) of revenue; economies of scale; funding security; etc.) and their recovery after a sharp sell-off can take longer.
Gold Scenarios for Miners: What Happened in 2026
| Rising Gold | Steep Sell-off | Rangebound Gold | Gold Pullback | |
| Gold Price Environment | Gold continues higher from record levels | Gold falls sharply, far beyond a normal pullback | Gold consolidates near recent levels | Gold declines, but remains above levels implied by current valuation assumptions |
| Gold Equities Performance | Strong outperformance vs. gold via operating leverage | Miners fall more than gold as broad risk-off selling compounds the move | Outperformance still possible through valuation re-rating | Resilient performance, supported by cash flow |
| Valuations & Margins | Re-rating accelerates; record margins persist | Valuations compress with the broad market; margins narrow but remain wide | Valuations adjust upward as spot prices are validated | Margins compress modestly but remain historically high |
| Investor Implication | Leveraged upside to a rising gold price | Share prices can overshoot fundamentals on the downside | Gold equities work even without higher gold prices | Downside cushioned by conservative assumptions |
| What Actually Happened | Dec 31 – Jan 28: gold +25.4%, GDX +30.8%, GDXJ +32.2%. Miners outperformed, but captured only about 1.2–1.3x of gold's move. | Jan 28 – Jun 10: gold −24.8%, GDX −34.2%, GDXJ −37.1%. Too much for miners to absorb; they fell about 1.4–1.5x as much as gold. | Jun 10 – Oct 31: gold −4.9%, GDX +4.4%, GDXJ +0.5%. Miners outperformed through re-rating. | Year to date, Dec 31 – Oct 31: gold −10.3%, GDX −10.1%, GDXJ −16.5%. Seniors held up with gold; juniors lagged. |
Source: VanEck and Bloomberg. Data as of 10/31/2026. For illustrative purposes only. Not a projection of future results. Returns for periods less than one year are not annualized. Past performance is no guarantee of future results. Fund performance current to the most recent month end is available by visiting vaneck.com or by calling 800.826.2333. See standardized performance and important disclosures below.
Note: Return ratios compare mining stock returns with gold returns over each period. For example, a ratio of 1.2x means mining stocks rose or fell 1.2 times as much as gold. Beta measures sensitivity to daily gold returns, while correlation measures how closely daily returns move together. These measures describe different aspects of the relationship and may vary by period.
The asymmetry is worth noting. When gold surged in January, miners captured only about 1.2x to 1.3x of the move.
This is not uncommon in the earlier stages of a rally: investors doubt the higher price will last and do not fully price it into the stocks. When gold reversed, miners fell about 1.4x to 1.5x as much. In addition, the first leg of the sell-off, which included the start of the war in Iran, was a broad-based sell-off across global equity markets, and we believe that added to the selling pressure on gold stocks on top of the move in gold itself. A market that is slow to give credit on the way up and quick to take it away on the way down can leave the stocks below what the fundamentals support. The range-bound period, when miners rose while gold drifted lower, looks like some of that gap closing.
Recommended subscription
The Business Behind the Share Price
Miners' share prices have followed gold on the way down, but we believe their businesses have not weakened. What is behind that resilience?
- Wide margins – Gold has risen faster than mining costs, leaving industry margins historically strong. Gold has averaged about $4,500 an ounce so far in 2026, more than $1,000 above the 2025 average of $3,445. Industry-wide all-in sustaining costs are estimated to have risen by about $300 an ounce over the same period.
- Strong balance sheets – Net cash positions continue to grow at many producers, as record free cash flow lets them pay down debt.
- Potential shareholder returns – Strong cash generation gives many producers flexibility to support dividends and buybacks, and some smaller companies have introduced their own capital return programs.
- Growth re-enters the conversation – After years of underinvestment, companies can step up exploration, advance organic projects and consider M&A. Replacing depleted ounces remains a challenge, especially for the largest producers, but cash generation is translating into more attractive growth prospects for the sector.
Growth Spending and the Valuation Gap
The market’s reaction to capital plans offers another example of what we see as a valuation disconnect. Despite the market’s clear focus on growth, often when gold producers announce a large project or update project capex estimates, their stock price falls. Project capital estimates can rise as studies are updated to reflect industry cost inflation or the scope changes. Investors view these updates negatively in part because they remember the previous gold bull cycle when capital discipline slipped. But today producers are more restrained, and they can generally fund projects from operating cash flow without issuing debt or equity or putting on disproportionate gold price hedges. In addition, they set reserves, resources and project economics at gold prices well below spot. For projects evaluated at lower gold prices, a moderate pullback from $4,000 may still leave expected returns above the required hurdle.
While we understand the skepticism, we believe the market's punishment of capital plans is generally excessive relative to the funding risk. We believe these fundamentals could support share prices over time, even as short-term moves remain closely tied to gold. The risks worth watching are cost inflation, operational performance and project execution.
Of course, we would all like to see gold move higher and margins expand further. But after a year like this one, what gold stocks may need most is for gold to go quiet at these levels for a while. A calmer metal would give the companies room to show what they have built, with strong margins, net cash balances, and credible growth plans, without a market distracted by swings of 20% or more in the price of gold. We believe that when investors can focus more on the underlying business and less on the next move in the metal, the stocks may have a chance to reflect these strong fundamentals. That gap between the stocks and the businesses behind them is the opportunity we see.

Important Disclosures
All company, sector, and sub-industry weightings as of October 31, 2026, unless otherwise noted.
Please note that VanEck may offer investment products that invest in the asset class(es) or industries included in this communication.
This is not an offer to buy or sell, or a solicitation of any offer to buy or sell any of the securities mentioned herein. The information presented does not involve the rendering of personalized investment, financial, legal, or tax advice. Certain statements contained herein may constitute projections, forecasts and other forward-looking statements, which do not reflect actual results.
Please note that the information herein represents the opinion of the author, but not necessarily those of VanEck, and this opinion may change at any time and from time to time. Non-VanEck proprietary information contained herein has been obtained from sources believed to be reliable but not guaranteed. Not intended to be a forecast of future events, a guarantee of future results or investment advice. Historical performance is not indicative of future results. Current data may differ from data quoted. Any graphs shown herein are for illustrative purposes only. No part of this material may be reproduced in any form, or referred to in any other publication, without express written permission of VanEck.
Diversification does not assure a profit or protect against loss.
Nothing in this content should be considered a solicitation to buy or an offer to sell shares of any investment in any jurisdiction where the offer or solicitation would be unlawful under the securities laws of such jurisdiction, nor is it intended as investment, tax, financial, or legal advice. Investors should seek such professional advice for their particular situation and jurisdiction.
1MarketVector Global Gold Miners Index (MVGDXTR) tracks the overall performance of companies involved in the gold mining industry.
MVIS Global Junior Gold Miners Index (MVGDXJTR) tracks the overall performance of small- and mid-capitalization companies involved in the gold and/or silver mining industry.
NYSE Arca Gold Miners Index (GDMNTR) is a modified market capitalization-weighted index comprised of publicly traded companies involved primarily in the mining of gold and silver.
Any indices listed are unmanaged indices and include the reinvestment of all dividends, but do not reflect the payment of transaction costs, advisory fees or expenses that are associated with an investment in a Fund. Certain indices may take into account withholding taxes. An index’s performance is not illustrative of a Fund’s performance. Indices are not securities in which investments can be made.
MarketVector Global Gold Miners Index is the exclusive property of MarketVector Indexes GmbH which has contracted with Solactive AG to maintain and calculate the Index. Solactive AG uses its best efforts to ensure that the Index is calculated correctly. Irrespective of its obligations towards MarketVector Indexes GmbH, Solactive AG has no obligation to point out errors in the Index to third parties.
Investments in commodities can be very volatile and direct investment in these markets can be very risky, especially for inexperienced investors.
An investment in GDX may be subject to risks which include, but are not limited to, risks related to investments in gold and silver mining companies, special risk considerations of investing in Canadian issuers, foreign securities, emerging market issuers, foreign currency, depositary receipts, small- and medium-capitalization companies, equity securities, market, operational, index tracking, authorized participant concentration, no guarantee of active trading market, trading issues, passive management, fund shares trading, premium/discount, liquidity of fund shares, high portfolio turnover, non-diversified and index-related concentration risks, all of which may adversely affect the Fund. Emerging market issuers and foreign securities may be subject to securities markets, political and economic, investment and repatriation restrictions, different rules and regulations, less publicly available financial information, foreign currency and exchange rates, operational and settlement, and corporate and securities laws risks. Small- and medium-capitalization companies may be subject to elevated risks.
| 1 MO | 3 MO | YTD | 1 YR | 3 YR | 5 YR | 10 YR | LIFE 05/16/06 | |
| GDX (NAV) | -11.02 | 16.47 | 2.05 | 15.85 | 49.98 | 26.11 | 13.84 | 4.79 |
| GDX (Market Price) | -10.87 | 16.37 | 2.37 | 15.72 | 50.02 | 26.09 | 13.83 | 4.79 |
| MarketVector Global Gold Miners Index | -10.89 | 16.97 | 2.45 | 16.75 | 50.69 | 26.66 | 14.29 | 5.25 |
*Returns less than one year are not annualized.
Index data prior to September 22, 2025 reflects that of the NYSE Arca Gold Miners Index (GDMNTR). From September 22, 2025 forward, the index data reflects that of the Fund's underlying index, MarketVector Global Gold Miners Index (MVGDXTR). Not intended for third party use.
The performance data quoted represents past performance. Past performance is not a guarantee of future results. Investment return and principal value of an investment will fluctuate so that an investor's shares, when redeemed, may be worth more or less than their original cost. Performance may be lower or higher than performance data quoted. Please call 800.826.2333 or visit vaneck.com for performance current to the most recent month ended.
GDX Gross Expense Ratio: 0.51%
An investment in GDXJ may be subject to risks which include, but are not limited to, risks related to investments in gold and silver mining companies, special risk considerations of investing in Australian and Canadian issuers, foreign securities, emerging market issuers, foreign currency, depositary receipts, micro-, small- and medium-capitalization companies, equity securities, market, operational, index tracking, authorized participant concentration, no guarantee of active trading market, trading issues, passive management, fund shares trading, premium/discount risk and liquidity of fund shares, non-diversified, and index-related concentration risks, all of which may adversely affect the Fund. Emerging market issuers and foreign securities may be subject to securities markets, political and economic, investment and repatriation restrictions, different rules and regulations, less publicly available financial information, foreign currency and exchange rates, operational and settlement, and corporate and securities laws risks. Micro-, small- and medium-capitalization companies may be subject to elevated risks.
| 1 MO | 3 MO | YTD | 1 YR | 3 YR | 5 YR | 10 YR | LIFE 11/10/09 | |
| GDXJ (NAV) | -11.21 | 15.90 | -0.31 | 17.85 | 55.02 | 26.29 | 11.63 | 2.89 |
| GDXJ (Market Price) | -10.93 | 15.98 | 0.15 | 17.57 | 55.11 | 26.27 | 11.60 | 2.89 |
| MVIS Global Junior Gold Miners Index | -11.08 | 16.77 | 0.34 | 19.25 | 56.29 | 27.21 | 12.13 | 3.34 |
*Returns less than one year are not annualized.
The performance data quoted represents past performance. Past performance is not a guarantee of future results. Investment return and principal value of an investment will fluctuate so that an investor's shares, when redeemed, may be worth more or less than their original cost. Performance may be lower or higher than performance data quoted. Please call 800.826.2333 or visit vaneck.com for performance current to the most recent month ended.
GDXJ Gross Expense Ratio: 0.52%
Investing involves substantial risk and high volatility, including possible loss of principal. An investor should consider the investment objective, risks, charges and expenses of a Fund carefully before investing. To obtain a prospectus and summary prospectus, which contain this and other information, call 800.826.2333 or visit vaneck.com. Please read the prospectus and summary prospectus carefully before investing.
© Van Eck Securities Corporation, Distributor, a wholly owned subsidiary of Van Eck Associates Corporation.
666 Third Avenue | New York, NY 10017
Related Funds
Important Disclosures
All company, sector, and sub-industry weightings as of October 31, 2026, unless otherwise noted.
Please note that VanEck may offer investment products that invest in the asset class(es) or industries included in this communication.
This is not an offer to buy or sell, or a solicitation of any offer to buy or sell any of the securities mentioned herein. The information presented does not involve the rendering of personalized investment, financial, legal, or tax advice. Certain statements contained herein may constitute projections, forecasts and other forward-looking statements, which do not reflect actual results.
Please note that the information herein represents the opinion of the author, but not necessarily those of VanEck, and this opinion may change at any time and from time to time. Non-VanEck proprietary information contained herein has been obtained from sources believed to be reliable but not guaranteed. Not intended to be a forecast of future events, a guarantee of future results or investment advice. Historical performance is not indicative of future results. Current data may differ from data quoted. Any graphs shown herein are for illustrative purposes only. No part of this material may be reproduced in any form, or referred to in any other publication, without express written permission of VanEck.
Diversification does not assure a profit or protect against loss.
Nothing in this content should be considered a solicitation to buy or an offer to sell shares of any investment in any jurisdiction where the offer or solicitation would be unlawful under the securities laws of such jurisdiction, nor is it intended as investment, tax, financial, or legal advice. Investors should seek such professional advice for their particular situation and jurisdiction.
1MarketVector Global Gold Miners Index (MVGDXTR) tracks the overall performance of companies involved in the gold mining industry.
MVIS Global Junior Gold Miners Index (MVGDXJTR) tracks the overall performance of small- and mid-capitalization companies involved in the gold and/or silver mining industry.
NYSE Arca Gold Miners Index (GDMNTR) is a modified market capitalization-weighted index comprised of publicly traded companies involved primarily in the mining of gold and silver.
Any indices listed are unmanaged indices and include the reinvestment of all dividends, but do not reflect the payment of transaction costs, advisory fees or expenses that are associated with an investment in a Fund. Certain indices may take into account withholding taxes. An index’s performance is not illustrative of a Fund’s performance. Indices are not securities in which investments can be made.
MarketVector Global Gold Miners Index is the exclusive property of MarketVector Indexes GmbH which has contracted with Solactive AG to maintain and calculate the Index. Solactive AG uses its best efforts to ensure that the Index is calculated correctly. Irrespective of its obligations towards MarketVector Indexes GmbH, Solactive AG has no obligation to point out errors in the Index to third parties.
Investments in commodities can be very volatile and direct investment in these markets can be very risky, especially for inexperienced investors.
An investment in GDX may be subject to risks which include, but are not limited to, risks related to investments in gold and silver mining companies, special risk considerations of investing in Canadian issuers, foreign securities, emerging market issuers, foreign currency, depositary receipts, small- and medium-capitalization companies, equity securities, market, operational, index tracking, authorized participant concentration, no guarantee of active trading market, trading issues, passive management, fund shares trading, premium/discount, liquidity of fund shares, high portfolio turnover, non-diversified and index-related concentration risks, all of which may adversely affect the Fund. Emerging market issuers and foreign securities may be subject to securities markets, political and economic, investment and repatriation restrictions, different rules and regulations, less publicly available financial information, foreign currency and exchange rates, operational and settlement, and corporate and securities laws risks. Small- and medium-capitalization companies may be subject to elevated risks.
| 1 MO | 3 MO | YTD | 1 YR | 3 YR | 5 YR | 10 YR | LIFE 05/16/06 | |
| GDX (NAV) | -11.02 | 16.47 | 2.05 | 15.85 | 49.98 | 26.11 | 13.84 | 4.79 |
| GDX (Market Price) | -10.87 | 16.37 | 2.37 | 15.72 | 50.02 | 26.09 | 13.83 | 4.79 |
| MarketVector Global Gold Miners Index | -10.89 | 16.97 | 2.45 | 16.75 | 50.69 | 26.66 | 14.29 | 5.25 |
*Returns less than one year are not annualized.
Index data prior to September 22, 2025 reflects that of the NYSE Arca Gold Miners Index (GDMNTR). From September 22, 2025 forward, the index data reflects that of the Fund's underlying index, MarketVector Global Gold Miners Index (MVGDXTR). Not intended for third party use.
The performance data quoted represents past performance. Past performance is not a guarantee of future results. Investment return and principal value of an investment will fluctuate so that an investor's shares, when redeemed, may be worth more or less than their original cost. Performance may be lower or higher than performance data quoted. Please call 800.826.2333 or visit vaneck.com for performance current to the most recent month ended.
GDX Gross Expense Ratio: 0.51%
An investment in GDXJ may be subject to risks which include, but are not limited to, risks related to investments in gold and silver mining companies, special risk considerations of investing in Australian and Canadian issuers, foreign securities, emerging market issuers, foreign currency, depositary receipts, micro-, small- and medium-capitalization companies, equity securities, market, operational, index tracking, authorized participant concentration, no guarantee of active trading market, trading issues, passive management, fund shares trading, premium/discount risk and liquidity of fund shares, non-diversified, and index-related concentration risks, all of which may adversely affect the Fund. Emerging market issuers and foreign securities may be subject to securities markets, political and economic, investment and repatriation restrictions, different rules and regulations, less publicly available financial information, foreign currency and exchange rates, operational and settlement, and corporate and securities laws risks. Micro-, small- and medium-capitalization companies may be subject to elevated risks.
| 1 MO | 3 MO | YTD | 1 YR | 3 YR | 5 YR | 10 YR | LIFE 11/10/09 | |
| GDXJ (NAV) | -11.21 | 15.90 | -0.31 | 17.85 | 55.02 | 26.29 | 11.63 | 2.89 |
| GDXJ (Market Price) | -10.93 | 15.98 | 0.15 | 17.57 | 55.11 | 26.27 | 11.60 | 2.89 |
| MVIS Global Junior Gold Miners Index | -11.08 | 16.77 | 0.34 | 19.25 | 56.29 | 27.21 | 12.13 | 3.34 |
*Returns less than one year are not annualized.
The performance data quoted represents past performance. Past performance is not a guarantee of future results. Investment return and principal value of an investment will fluctuate so that an investor's shares, when redeemed, may be worth more or less than their original cost. Performance may be lower or higher than performance data quoted. Please call 800.826.2333 or visit vaneck.com for performance current to the most recent month ended.
GDXJ Gross Expense Ratio: 0.52%
Investing involves substantial risk and high volatility, including possible loss of principal. An investor should consider the investment objective, risks, charges and expenses of a Fund carefully before investing. To obtain a prospectus and summary prospectus, which contain this and other information, call 800.826.2333 or visit vaneck.com. Please read the prospectus and summary prospectus carefully before investing.
© Van Eck Securities Corporation, Distributor, a wholly owned subsidiary of Van Eck Associates Corporation.
666 Third Avenue | New York, NY 10017