Another DM Warning, Same EM Bond Opportunity.
August 10, 2026
Read Time 5 MIN
Key Takeaways
- Developed market economies continue to be the risk generators. Fiscal dominance, sanctions, and war footings are combining to make DM risks clearer to markets, with Japan and Europe as the key focal points.
- Japan's fiscal dominance trap is self-reinforcing. The BoJ cannot raise rates to defend the yen without eroding its own balance sheet.
- EMs remain broadly attractive but selective. Most benchmark constituents are commodity exporters with a solid fiscal stance; Colombia, LatAm, and China stand out while Indonesia, India, and Thailand are avoided.
- EMBX continues to offer compelling income with a yield-to-worst of 7.93%.
Another DM Warning, Same EM Bond Opportunity.
The VanEck Emerging Markets Bond ETF (EMBX) returned -0.22% in July, compared to -0.56% for its benchmark, the 50% J.P. Morgan Government Bond Index - Emerging Markets Global Diversified (GBI-EM) and 50% J.P. Morgan Emerging Markets Bond Index (EMBI) and -0.83% for the Global Agg and -1.72% for US Treasuries. Year to date, EMBX is up 3.39%, compared to up 1.86% for its benchmark, and -1.30% for the Global Agg and -1.70% for US Treasuries. South Korea local (overweight), Senegal USD (overweight), and Hungary local and hard (underweights) contributed most to July outperformance. Democratic Republic of Congo (overweight) detracted the most. Local currency exposure is currently even lower at 36.0%, much due to zero-weights in local currency in large benchmark constituents India and Indonesia. Carry is 6.42, yield to worst (YTW) is 7.93 and duration decreased further to 5.6.
VanEck Emerging Markets Bond ETF (EMBX) Performance
Average Annual Total Returns* (%)
| Month End As of 07/31/2026 | 1 MO | 3 MO | YTD | 1 YR | 3 YR | 5 YR | 10 YR | LIFE 07/09/12 |
| EMBX (NAV) | -0.22 | 0.68 | 3.39 | 11.48 | 9.33 | 4.71 | 5.02 | 3.66 |
| EMBX (Market Price) | 0.18 | 0.77 | 3.80 | 11.80 | 9.43 | 4.77 | 5.05 | 3.68 |
| 50% GBI-EM/50% EMBI | -0.56 | 0.82 | 1.86 | 8.93 | 7.79 | 2.29 | 3.07 | 2.71 |
Average Annual Total Returns* (%)
| Quarter End As of 06/30/2026 | 1 MO | 3 MO | YTD | 1 YR | 3 YR | 5 YR | 10 YR | LIFE 07/09/12 |
| EMBX (NAV) | 0.13 | 4.54 | 3.61 | 11.58 | 10.00 | 4.55 | 5.14 | 3.70 |
| EMBX (Market Price) | -0.03 | 3.82 | 3.61 | 11.46 | 9.96 | 4.53 | 5.13 | 3.69 |
| 50% GBI-EM/50% EMBI | 0.46 | 4.25 | 2.43 | 9.83 | 8.85 | 2.40 | 3.25 | 2.76 |
* Returns less than one year are not annualized.
30‑Day SEC Yield of 5.98% as of September 18, 2026
EMBX Prospectus Here: https://vaneck.onlineprospectus.net/vaneck/EMBX/index.php?ctype=Summary
EMBX Gross Expense Ratio – 0.76%
The performance data quoted represents past performance. Past performance is not a guarantee of future results. Investment return and principal value of an investment will fluctuate so that an investor's shares, when redeemed, may be worth more or less than their original cost. Performance may be lower or higher than performance data quoted. Please call 800.826.2333 or visit vaneck.com for performance current to the most recent month ended.
Prior to 10/06/2025, the Fund operated as the VanEck Emerging Markets Bond mutual fund; performance shown before that date is that fund’s NAV performance (Class I, unadjusted for today’s ETF expenses).
Recommended subscription
Developed market economies continue to be the risk generators. Fiscal dominance, sanctions, and war footings are combining to make these risks in DMs clearer to markets, with Japan again a focus. Watch what French elections do to Europe, as the next act in what is a DM play. We’ve written about this continuously for 15 years. Fiscal dominance – the loss of monetary traction resulting from high government debt – set the stage, with the global financial crisis (GFC) as the main act. DMs, in particular the US, started running even larger twin deficits (fiscal and external), powered by monetary experimentation (price set to 0%, base money targeted), with the surpluses going to China, Asia, and many other EMs (Brazil remains a sovereign net creditor in USD, for example). The DM countries such as the US with their large financing needs dependent on offshore borrowing, nonetheless still sanctioned their lenders, creating new risks to treasuries and the USD. The recent war against Iran focuses great attention, now, because the USD already cannot with certainty be translated into oil if you are, for example, China. Imagine what this does to the demand for safe assets like gold, oh wait, you don’t need to imagine.
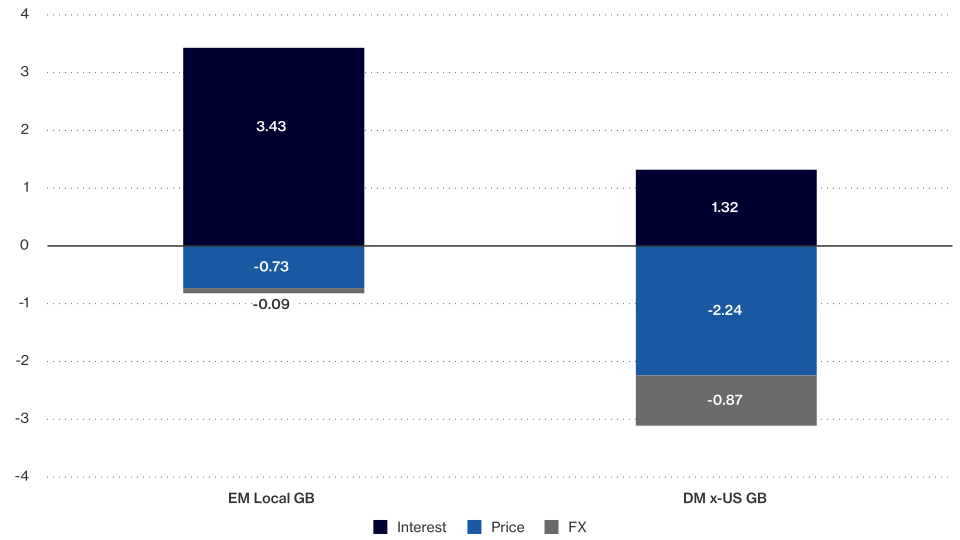
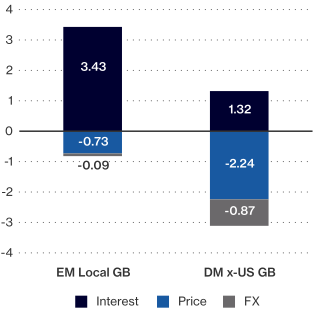
EM and DM x-US Government Bonds Total Return Breakdown (%), 31 Dec 2025 to 5 Aug 2026
Source: Bloomberg. Data as of August 2026.
Japan is the poster child for fiscal dominance, take notes, this will be on the final exam. It has a high stock of government debt (~204% of GDP on the IMF's general government gross measure), negative real short rates even after tightening (the policy rate at 1.00% with CPI at 60 basis points (bps)), and a currency that now literally requires US support. The latest operation was the first US-Japan joint yen-buying intervention since 1998 — with the New York Fed conducting a rate check and the US Treasury pre-warning banks that intervention was coming, an inversion of the surprise logic that normally makes intervention work, and with Washington rather than Tokyo issuing the warning. The Fed sold euros to buy yen while the FIMA repo facility let Japan borrow dollars against Treasuries rather than sell them outright — a structure designed specifically to avoid Japanese liquidation of the US curve.
But the Bank of Japan (BoJ) cannot raise rates fast enough to defend the yen, because doing so damages the financial system, starting with itself. Unrealized losses on its Japanese government bonds (JGB) holdings reached a record ¥45.4 trillion at the March 2026 fiscal year-end, up from ¥28.6 trillion a year earlier — an increase driven almost entirely by its own tightening. Note that these are disclosed, not marked: the Bank holds to maturity, carries the portfolio at cost, and the losses never touch its earnings statements. The standard rebuttal stops there, and then goes one step further — the BoJ is part of the consolidated public sector, so its loss is the Treasury's offsetting gain on cheap fixed-rate funding, and the whole thing is an intra-government wash. That rebuttal fails, and the reason it fails is the point. Consolidation does not net the exposure away; it relabels it. QE swapped long-dated fixed-rate government liabilities for overnight floating-rate central bank reserves. The consolidated public sector's effective debt maturity is therefore far shorter than the JGB maturity profile implies, which means the fiscal cost of each hike lands immediately rather than amortizing across a refinancing schedule. As the policy rate rises, interest paid on current account balances at the Bank climbs and eventually surpasses interest income on a portfolio accumulated at near-zero coupons. Fiscal dominance here operates through the central bank's P&L, and any recapitalization requires fiscal resources.
The private demand side is deteriorating in parallel, which is what makes the low flow deficit irrelevant. Life insurers have rotated away from long-dated JGBs — mark-to-market losses made the long end unattractive, and with the duration gap narrowed they no longer face the ALM pressure that historically forced them to buy. The BoJ's own bond market participants cite IRRBB constraints and a narrowing loan-to-deposit gap at depository institutions as limits on how much banks can absorb. Meanwhile the BoJ has gone from buyer of last resort to seller: total assets are down ¥116.9 trillion, or 15.6%, from the Q1 2024 peak, with JGB holdings down ¥73.9 trillion from the 2023 peak to ¥518.3 trillion as of June 30. Every incremental basis point of tightening simultaneously deepens the losses on existing holdings and pushes the remaining domestic bid further toward the exit — which is why the yen reached 163.73, a near four-decade low, before the intervention.
EMs are generally in good shape, but most importantly are diverse. The top-level reason is that most EMs learned their fiscal dominance lessons decades ago, plus most of our benchmark are exporters as well as commodities exporters. There’s also demand for their government bonds as reserve assets, as central banks continue to expand their roster of safe assets beyond gold. But, we said it is diverse, not all good. Indonesia is failing the latest tests thrown by markets, to our eye, India was never ready for “prime time” in the first place, and Thailand is clearly vulnerable to higher oil prices, etc. So just be underweight or don’t own them, like ourselves. But, Treasuries have lagged yet again, and we continue to find attractive bonds in EM. Colombia, much of Latin America and Sub-Saharan Africa are better positioned as they are commodities exporters, and China’s currency continues to act as a rising reserve currency, with potential tailwinds for its EM trading partners. That’s been our thesis for a while, so we won’t belabor it.
Exposure Types and Significant Changes
The changes to our top positions are summarized below. Our largest positions in July were Mexico, China, Brazil, Chile and Malaysia.
- We increased our local currency exposure in Colombia and hard currency sovereign exposure in Angola. Colombia’s assets benefitted a lot from the post-election political shift, which improved the policy test score for the country. Further upside still exists, but it will be conditional on the approval of the frontloaded fiscal consolidation plan. Regarding Angold, oil prices are off the Iran war highs, but they are likely to remain elevated until a clear de-escalation pathway emerges. In terms of our investment process, this improved the technical test score for Colombia.
- We also increased our hard currency sovereign exposure in Israel and the Democratic Republic of the Congo. Bond valuations in both countries improved a lot lately, and the ceasefire diplomacy in the Middle East is gaining traction, boosting the respective technical and policy test scores.
- Finally, we increased our hard currency sovereign exposure in Pakistan and Senegal. Pakistan is expected to benefit from the improved oil market prospects, as well as from the commendable policy response during the war. In terms of our investment process, this translates into stronger policy and technical test scores for the country. The key consideration in Senegal is the market’s exaggerated concerns about the timing of a potential debt restructuring deal, which improved the technical and policy test scores.
- We reduced our local currency exposure in Indonesia and Malaysia. Indonesia’s policy backdrop is getting more complicated, with the sudden resignation of the central bank’s governor raiding additional concerns about the impact of the pro-growth push on local debt. In terms of our investment process, this worsened the policy test score for the country. Malaysia will not be a winner if oil prices will continue to drift down on the back of the Middle East developments, which worsened the technical test score for the country.
- We also reduced our local currency exposure in Thailand and Taiwan. Thailand’s valuations do not look attractive, and the external balance’s structural deterioration is likely to offset the positive impact of lower oil prices. Thailand will also not be a winner if the Middle East tensions spike again. This worsened the economic and technical test scores for the country. Taiwan is set to be affected by the double impact of the AI trade unwind and potential oil price spikes, both of which worsened the country’s technical test score.
- Finally, we reduced our hard currency sovereign exposure in Saudi Arabia and Jordan. The key reason in both countries is duration exposure – specifically, the impact of the Fed’s mangled communications on the inflation outlook and the U.S. duration. In terms of our investment process, this worsened the technical test score for both countries.
EMBX | VanEck Emerging Markets Bond ETF
To receive more Emerging Markets Bonds insights, sign up in our subscription center.

Important Disclosures
There is no guarantee that these conditions will persist or that the fund will achieve similar results in the future.
This is not an offer to buy or sell, or a recommendation to buy or sell any of the securities, financial instruments or digital assets mentioned herein. The information presented does not involve the rendering of personalized investment, financial, legal, tax advice, or any call to action. Certain statements contained herein may constitute projections, forecasts and other forward-looking statements, which do not reflect actual results, are for illustrative purposes only, are valid as of the date of this communication, and are subject to change without notice. Actual future performance of any assets or industries mentioned are unknown. Information provided by third party sources are believed to be reliable and have not been independently verified for accuracy or completeness and cannot be guaranteed. VanEck does not guarantee the accuracy of third party data. The information herein represents the opinion of the author(s), but not necessarily those of VanEck or its other employees.
Duration measures a bond’s sensitivity to interest rate changes that reflects the change in a bond’s price given a change in yield. This duration measure is appropriate for bonds with embedded options. Carry is the benefit or cost for owning an asset. Yield to worst is a measure of the lowest possible yield that can be received on a bond with an early retirement provision. Averages are market weighted. The yields presented do not represent the performance of the Fund. These statistics do not take into account fees and expenses associated with investments of the Fund.
30-Day SEC Yield is a standard yield calculation developed by the Securities and Exchange Commission that allows for fairer comparisons among funds. It is based on the most recent 30-day period. This yield figure reflects the interest earned during the period after deducting the Fund’s expenses for the period. It does not reflect the yield an investor would have received if they had held the Fund over the last twelve months assuming the most recent NAV.
All indices are unmanaged and include the reinvestment of all dividends, but do not reflect the payment of transaction costs, advisory fees or expenses that are associated with an investment in the Fund. Certain indices may take into account withholding taxes. An index’s performance is not illustrative of the Fund’s performance. Indices are not securities in which investments can be made.
The Fund’s benchmark index (50% GBI-EM/50% EMBI) is a blended index consisting of 50% J.P. Morgan Government Bond Index-Emerging Markets (GBI-EM) Global Diversified and 50% J.P. Morgan Emerging Markets Bond Index (EMBI). The J.P. Morgan GBI-EM Global Diversified tracks local currency bonds issued by Emerging Markets governments. The J.P. Morgan EMBI Global Diversified tracks returns for actively traded external debt instruments in emerging markets, and is also J.P. Morgan’s most liquid U.S. dollar emerging markets debt benchmark.
The Bloomberg Global Aggregate Index measures the performance of global investment grade fixed income securities.
The FTSE 10-Year US Treasuries Index measures the return of the 10-year U.S. Treasury.
An investment in the VanEck Emerging Markets Bond ETF may be subject to risks which include, among others, risks related to active management, credit, credit-linked notes, currency management strategies, derivatives, emerging market issuers, ESG investing, foreign currency, foreign securities, hedging, high portfolio turnover, high yield securities, interest rate, market, non-diversified, operational, restricted securities, investing in other funds, sovereign bond, special risk considerations of investing in African, Asian, and Latin American issuers, authorized participant concentration, no guarantee of active trading market, trading issues, fund shares trading, premium/discount and liquidity of fund shares, and cash transactions risks, all of which may adversely affect the Fund. Emerging market issuers and foreign securities may be subject to securities markets, political and economic, investment and repatriation restrictions, different rules and regulations, less publicly available financial information, foreign currency and exchange rates, operational and settlement, and corporate and securities laws risks.
Investing involves substantial risk and high volatility, including possible loss of principal. An investor should consider the investment objective, risks, charges and expenses of a Fund carefully before investing. To obtain a prospectus and summary prospectus, which contain this and other information, call 800.826.2333 or visit vaneck.com. Please read the prospectus and summary prospectus carefully before investing.
© Van Eck Securities Corporation, Distributor, a wholly-owned subsidiary of Van Eck Associates Corporation.
Related Funds
Important Disclosures
There is no guarantee that these conditions will persist or that the fund will achieve similar results in the future.
This is not an offer to buy or sell, or a recommendation to buy or sell any of the securities, financial instruments or digital assets mentioned herein. The information presented does not involve the rendering of personalized investment, financial, legal, tax advice, or any call to action. Certain statements contained herein may constitute projections, forecasts and other forward-looking statements, which do not reflect actual results, are for illustrative purposes only, are valid as of the date of this communication, and are subject to change without notice. Actual future performance of any assets or industries mentioned are unknown. Information provided by third party sources are believed to be reliable and have not been independently verified for accuracy or completeness and cannot be guaranteed. VanEck does not guarantee the accuracy of third party data. The information herein represents the opinion of the author(s), but not necessarily those of VanEck or its other employees.
Duration measures a bond’s sensitivity to interest rate changes that reflects the change in a bond’s price given a change in yield. This duration measure is appropriate for bonds with embedded options. Carry is the benefit or cost for owning an asset. Yield to worst is a measure of the lowest possible yield that can be received on a bond with an early retirement provision. Averages are market weighted. The yields presented do not represent the performance of the Fund. These statistics do not take into account fees and expenses associated with investments of the Fund.
30-Day SEC Yield is a standard yield calculation developed by the Securities and Exchange Commission that allows for fairer comparisons among funds. It is based on the most recent 30-day period. This yield figure reflects the interest earned during the period after deducting the Fund’s expenses for the period. It does not reflect the yield an investor would have received if they had held the Fund over the last twelve months assuming the most recent NAV.
All indices are unmanaged and include the reinvestment of all dividends, but do not reflect the payment of transaction costs, advisory fees or expenses that are associated with an investment in the Fund. Certain indices may take into account withholding taxes. An index’s performance is not illustrative of the Fund’s performance. Indices are not securities in which investments can be made.
The Fund’s benchmark index (50% GBI-EM/50% EMBI) is a blended index consisting of 50% J.P. Morgan Government Bond Index-Emerging Markets (GBI-EM) Global Diversified and 50% J.P. Morgan Emerging Markets Bond Index (EMBI). The J.P. Morgan GBI-EM Global Diversified tracks local currency bonds issued by Emerging Markets governments. The J.P. Morgan EMBI Global Diversified tracks returns for actively traded external debt instruments in emerging markets, and is also J.P. Morgan’s most liquid U.S. dollar emerging markets debt benchmark.
The Bloomberg Global Aggregate Index measures the performance of global investment grade fixed income securities.
The FTSE 10-Year US Treasuries Index measures the return of the 10-year U.S. Treasury.
An investment in the VanEck Emerging Markets Bond ETF may be subject to risks which include, among others, risks related to active management, credit, credit-linked notes, currency management strategies, derivatives, emerging market issuers, ESG investing, foreign currency, foreign securities, hedging, high portfolio turnover, high yield securities, interest rate, market, non-diversified, operational, restricted securities, investing in other funds, sovereign bond, special risk considerations of investing in African, Asian, and Latin American issuers, authorized participant concentration, no guarantee of active trading market, trading issues, fund shares trading, premium/discount and liquidity of fund shares, and cash transactions risks, all of which may adversely affect the Fund. Emerging market issuers and foreign securities may be subject to securities markets, political and economic, investment and repatriation restrictions, different rules and regulations, less publicly available financial information, foreign currency and exchange rates, operational and settlement, and corporate and securities laws risks.
Investing involves substantial risk and high volatility, including possible loss of principal. An investor should consider the investment objective, risks, charges and expenses of a Fund carefully before investing. To obtain a prospectus and summary prospectus, which contain this and other information, call 800.826.2333 or visit vaneck.com. Please read the prospectus and summary prospectus carefully before investing.
© Van Eck Securities Corporation, Distributor, a wholly-owned subsidiary of Van Eck Associates Corporation.