Venezuela: Sizing the Haircut, Valuing the Exchange
August 28, 2026
Read Time 11 MIN
Key Takeaways
- At $229bn of claims, Venezuela’s would be the largest emerging market sovereign restructuring on record. Bonds are $111bn of a hypothetical $174bn pari passu class measured to a 2028 exchange date and they compete for sustainable debt capacity with $63bn of equally ranking non-bond claims. There are $37bn of senior claims ahead of the pari passu class.
- Venezuela will most likely be treated as a ”market-access” country under the IMF’s framework, and the haircut it needs depends almost entirely on new elections and oil production. Anchored on public debt at 70% of GDP and under a $10bn official program, we find a required haircut of 26% under an opposition government, 54% if the incumbent wins, and 83% under political continuity. Treatment as a “low-income” country is the main downside risk and would deepen the required haircut to 72% under an opposition government and 97% if the incumbent wins.
- The political outcome, and the oil production it potentially delivers, dominate. Per $100 of face, bondholders recover 15.6 under political continuity, 54.1 if the incumbent wins a legitimate election and 99.7 under an opposition government, on oil production reaching 1.0, 1.95 and 2.6 million barrels a day by 2034. No other variable moves recovery as much.
- Dollarization is the economic anchor that serves creditors best. Ending hyperinflation requires an anchor the government cannot alter, which makes political change a precondition for economic stabilization. Dollarization costs $1.8bn, or 5% of reserves, because the economy has already informally dollarized. Dollarization also needs a smaller official program, Ecuador’s in 2000 was under 2% of GDP. Since official money is senior and comes straight out of bondholder recovery, the cheaper anchor is the better one for creditors.
- At a market price of 50.9, an incumbent win is close to fairly priced at 54.1, and only an opposition government provides material upside, realizing 49 points. Based on our model, market pricing implies a 38% probability of political continuity, the only outcome that loses money at this price. Considering that there is no calendar for new elections, that looks fair. For investors to realize upside in the bonds requires an election and for the official sector to keep its own program modest: at $18bn rather than $10bn, only an opposition government may still provide positive returns.
What are we doing and why?
To value a potential Venezuela bond exchange, two major unknowns need to be quantified, in addition to the future path of GDP for the next 10 years — the size of the haircut on creditor claims and the exit yield on post restructuring bonds. To determine the size of the haircut, the amount of debt Venezuela can sustainably repay needs to be determined. What follows is an exercise in educated guesswork that leaves ample room for a range of outcomes, which is a fair description of the terrain. There are layers of assumptions and limited verifiable facts to go by. Venezuela has had no IMF mission since 2004 and has no formal relationship with the Fund, so there is neither official data nor official sector guidance to constrain the valuations the market can imagine. Analysts can justify nearly any valuation that suits their market view. In this paper, the author has attempted to be unbiased and process-oriented, generating a range of outcomes primarily, and allowing conclusions to flow from those, whether or not they are consistent with current market pricing.
What do we need to know?
We define three political scenarios in this paper to frame the range of economic outcomes. Scenario 1 (S1) is political continuity, with the current government in place, no elections and no reform program. Scenario 2 (S2) is a legitimate election won by the incumbent government. Scenario 3 (S3) is a legitimate election won by the opposition. Each drives a different oil production path due to different levels of investment in the oil sector, and through that a different GDP path. We assume the debt exchange settles on 30 June 2028, and refer to that throughout as the exchange date.
Venezuela should exit the restructuring process with a sustainable debt burden that gives the economy room to grow and allows the government to borrow new debt at some future point. If Venezuela needs to use a large proportion of its future dollar earnings to service its restructured debt, it will lead to an eventual new default and restructuring. During that time, Venezuela will not have an opportunity to grow. More years will be wasted.
To determine debt sustainability, not only do we need to know the creditor claims on the government, but we also need to know the future GDP path. However, we do not even have statistics measuring the historical GDP path to work with! Economic data has not been collected by government statistics agencies or official sector institutions in years. The IMF has not had a mission since 2004. Years of poor governance and economic instability have left the Venezuelan government without skilled workers to collect the data. Due to these institutional limitations, we believe Venezuela should engage the IMF in an Article IV review and debt sustainability analysis. The IMF is the only independent, credible institution with the resources necessary to rebuild government statistics in a timely fashion and perform a credible, unbiased debt sustainability analysis.
A critical question is whether a Venezuelan restructuring would follow the IMF’s market access country (MAC) framework or the low-income country (LIC) framework. Because Venezuela has historically been a wealthy country, it has no CPIA score from the World Bank. While the speed and depth of its economic and institutional collapse could make it a LIC country today, a downgrade of status could take years and would be highly political. For that reason, the path of least resistance is for Venezuela’s restructuring to be under the MAC framework. It is worth considering, however, how Venezuela would look under a lower income country restructuring. The first requirement of the IMF’s LIC DSA will be to determine the country’s debt carrying capacity (DCC). The IMF determines the DCC by calculating a composite indicator (CI) score. The CI score is a function of the World Bank CPIA governance score, real GDP growth, import coverage of reserves, remittances to GDP, and world growth. For Venezuela, we do not know any of these numbers with certainty. However, based on reasonable assumptions for the current economic results, Venezuela’s CI score would be weak (< 2.69).
On plausible inputs our own calculation gives a score of 2.01, against a weak cutoff of 2.69. The determining factors are the weak institutional CPIA score and modest reserve coverage, which together account for roughly seven eighths of the total score.
Reserve coverage alone cannot lead to an upgrade, because the squared term makes the reserve contribution concave and its contribution peaks near 50% of annual imports. Growth alone also cannot lead to an upgrade, as even a decade of double-digit expansion moves the score by a few tenths. Only the CPIA governance score can upgrade it, which needs the long, slow process of rebuilding institutions to improve.
Composite indicator score — our estimate
| Component | Coefficient | Input | Contribution |
| CPIA governance score (1–6) | 0.385 | 1.81 | 0.70 |
| Real GDP growth, 10-year average (%) | 2.719 | −7.0 | −0.19 |
| Import coverage of reserves (%) | 4.052 | 47.3 | 1.92 |
| Import coverage of reserves, squared | −3.990 | 22.4 | −0.89 |
| Remittances / GDP (%) | 2.022 | 3.5 | 0.07 |
| World real GDP growth, 10-year average (%) | 13.520 | 3.0 | 0.41 |
| CI score | 2.01 | ||
| Classification (weak if ≤ 2.69) | WEAK |
Venezuela is not formally CPIA-rated; the 1.81 used here is our own assessment against the sixteen CPIA criteria, and would place it between Sudan and Yemen. Import coverage is the $13.5bn opening reserve stock against the five-year average import bill.
Hypothetical scenario analysis based on VanEck assumptions and estimates. For illustrative purposes only. Not a prediction, projection, recommendation or guarantee of future results. Actual results are unknown and are likely to differ materially.
Source: VanEck, As of August 2026
Recommended subscription
How much money does Venezuela owe and to whom?
Not all of Venezuela’s debt will be pari passu to bondholders. We need to determine how much debt will get the same treatment as bondholders in a restructuring, how much will be treated better, and how much worse. We detail the claims we can identify in the table below and classify them by seniority to bondholder claims. Of the $229bn in creditor claims we could identify, $37bn is senior to bondholders, $174bn is pari passu and $18bn is subordinate.
Ranking is not the same as treatment, and both need to be considered. The two senior classes are not treated alike: multilaterals and the IMF are repaid on their original terms, while bilateral creditors are reprofiled over seventeen years at a reduced rate, a maturity extension and a coupon cut but no reduction in principal, which is the Common Framework convention. A claim can rank senior and still take real relief — China, the Paris Club and JBIC all sit on the official creditor committee track. In Zambia’s restructuring the official creditor committee took zero nominal principal haircut but delivered NPV reduction through a three-year grace period in which only interest was paid, maturities extended beyond twenty years, and interest set at 1% for fourteen years and capped at 2.5% thereafter, resulting in an NPV reduction of close to 40%. Applied to Venezuela on the same terms, that provides a 35% reduction in present value with no write-down of face value. However, pari passu claims can take a nominal haircut, which is what happens to bonds and to the supplier notes in our model.
Greece is the more instructive comparison for official sector treatment, because it was a market-access case where Zambia was not. Its official creditors took no nominal reduction at all. Relief came through maturity extension and rate cuts delivered after the private exchange and conditional on program performance, while the European Central Bank and the national central banks, holding some 22% of the stock, were exchanged into new bonds with identical terms before the exchange and escaped entirely. The lesson for Venezuelan bondholders is threefold: the official sector will not write down principal, its relief may arrive later and on its own terms, and a large holder can be carved out altogether. Each of those deepens the adjustment the remaining creditors absorb.
We make two important judgment calls. Arbitration and judgment creditors hold roughly $30bn of adjudicated awards, of which some $5.5bn is enforcement-backed and effectively senior, paid through the CITGO process, with the residual folding into the exchange with a negotiating premium.1 And we treat the Russian and Rosneft exposure as subordinate rather than pari passu, on the grounds that a sanctioned creditor cannot be paid inside an OFAC-compliant deal.
One bond sits outside the restructuring: the PDVSA 2020, the only secured claim in the capital structure, backed by a pledge over CITGO Holding shares and therefore senior to both the unsecured bonds and the judgment creditors with respect to that collateral.2It is excluded from the $111bn bond claim and from every recovery figure in this paper, so our bond universe is the twenty-four defaulted unsecured instruments only.
Table 1. Debt perimeter by seniority to bondholders
| Claim | $bn | Senior | Pari | Subordinate | Treatment |
| Multilaterals — CAF, IDB | 5.2 | 5.2 | — | — | Preferred — not restructured |
| Bilateral — China (oil-collateralized) | 14.0 | 14.0 | — | — | OCC reprofiling, 0% nominal |
| Bilateral — Paris Club | 8.7 | 8.7 | — | — | OCC reprofiling, 0% nominal |
| Bilateral — Russia / Rosneft | 3.2 | — | — | 3.2 | Excluded — OFAC |
| Bilateral — other | 6.2 | — | 6.2 | — | Pari — nominal haircut |
| JBIC (export-credit agency) | 4.1 | 4.1 | — | — | OCC reprofiling, 0% nominal |
| Supplier and promissory notes | 16.0 | — | 16.0 | — | Pari — nominal haircut |
| Unsecured bonds — VENZ, PDVSA, ELECAR | 111.2 | — | 111.2 | — | DSA residual claimant |
| Arbitration awards and judgments | 30.9 | 5.5 | 25.4 | — | CITGO enforcement, then negotiated |
| Oil-major and commercial (un-adjudicated) | 15.0 | — | 15.0 | — | Pari — nominal haircut |
| Domestic debt (bolivar, local law) | 15.0 | — | — | 15.0 | Local law — separate |
| Total identified perimeter | 229.4 | 37.4 | 173.8 | 18.2 | |
| Share of identified perimeter | 100% | 17.0% | 74.8% | 8.2% |
USD bn. Russia and JBIC amounts are estimates and should be revised when the government discloses creditor data. Chinese lending is senior through export receivables, with third-party estimates putting the collateralized portion at $13–15bn.
Source: VanEck, As of August 2026
Venezuela’s outstanding debt and additional creditor claims were recently reported by the Financial Times to be as large as $240bn US dollars, citing unnamed government sources — some $11bn more than we can identify. We do not attempt to bridge our perimeter to that number, because the composition behind it is not public and any reconciliation would be invention. We treat it instead as a risk to the analysis. If the difference turns out to be pari-passu external debt rather than domestic obligations or contested accrued interest, the pari pool grows and every recovery figure in this paper falls. From our model’s estimates, an additional $11bn of pari-passu claims would deepen the required haircut by about four points and reduce recovery by roughly five points.
Because of the scale of both the senior and the pari passu claims, some bondholders may be tempted to negotiate with the current Venezuelan government without IMF or official sector involvement. Any such agreement would be unlikely to have a long shelf life, since Venezuela’s growth will depend on significant debt relief and a credible reform program.
Bondholders do not have first claim on whatever sustainable debt capacity exists. Senior debt creates the single largest downward adjustment to bondholder recovery value in this analysis. Roughly $63bn of non-bond claims rank equally with them, so on a comparable-treatment basis the capacity available to the pari class must cover $174bn of claims rather than the $111bn of bonds alone. That deepens the haircut every pari creditor takes. Nor do we assume bondholders are favored within the pari class. We allocate capacity pro rata as a modelling convention rather than a legal entitlement: it rests on IMF program conditionality, which obliges a debtor to seek comparable treatment from its external creditors, and on the absence of any recent sovereign restructuring in which bondholders were carved out for better terms than other unsecured external claims.
One route would shrink the pari class rather than reorder it. Roughly $25bn of the non-bond claims are arbitration awards and judgments held largely by oil companies, and those could be settled with equity in new production rather than with cash. Converting all of them lifts bondholder recovery by sixteen points under an opposition government and nine if the incumbent wins.
The future of oil production in Venezuela will determine its economic future
For bondholders, a recovery of Venezuela’s oil sector is the primary economic concern. It will be the only major source of the foreign currency needed to service the restructured bonds for many years. VanEck’s Antonio de Pinho kindly provided his expert oil sector forecasts for this portion of the analysis. We envisage 3 oil sector recovery scenarios that are directly tied to political outcomes: political continuity, legitimate elections with the current government winning and legitimate elections with an opposition government winning.
In the political continuity scenario (S1), we expect only brownfield investment as oil companies want to limit new money investment due to a lack of a legal framework and a history of expropriation of assets from the current government. In our political continuity scenario this leaves production eroding from a 1.15mm bpd peak in 2028 to below 1.0mm bpd by 2034, because PDVSA’s organic financing of $2.4bn a year falls short of the $3.5bn maintenance requirement.
In the two election scenarios, production can reach much higher levels as oil companies invest in new greenfield projects and the related necessary infrastructure. For these elections to lead to legislation recognized as legitimate, the US government will need to ensure a reform of the electoral commission and that all potential candidates are allowed to run freely. In the scenario where the current government wins (S2), oil production can reach 1.95mm bpd by 2034 but is constrained by a less favorable business climate and terms for producers. In the scenario where the opposition wins (S3), oil production can increase to 2.6mm bpd by 2034 and 3.0mm bpd by 2039 due to stronger property rights and more favorable economic terms for producers, including potentially a fully privatized oil sector. Under all 3 scenarios, we assume the US government lifts sanctions on the Venezuelan government by the exchange date so that new exchange bonds can be issued for the defaulted debt.
The cash required to deliver these paths is substantial and it does not scale with barrels produced, because maintaining existing wells and developing new capacity cost very different amounts. Maintenance runs at roughly $3.2bn a year per million barrels a day of base production, while growth spending ranges from $45,000 per barrel a day for workovers and infill drilling to $70,000 for greenfield Orinoco development. Cumulative outlay to 2040, operating and capital combined, is $35.6bn under political continuity, $137.8bn if the incumbent wins and $211.2bn under an opposition government.
The continuity figure is almost entirely maintenance, and it is not a choice. PDVSA can self-fund about $2.4bn a year against a maintenance requirement of $3.5bn, so the shortfall is met by letting fields decline. That is why continuity is a scenario of eroding production rather than a low plateau. Growth spending of $0.3bn over fifteen years buys nothing.
Table 2. Oil production and the cash outlay required to achieve it
| Peak production (mn bbl/d) | Production 2034 | Maintenance outlay ($bn) | Growth outlay ($bn) | Total cash outlay ($bn) | Cumulative revenue ($bn) | |
| S1 Political continuity | 1.15 in 2028 | 1.00 | 35.3 | 0.3 | 35.6 | 272 |
| S2 Election, incumbent wins | 2.10 in 2039 | 1.95 | 81.0 | 56.8 | 137.8 | 529 |
| S3 Opposition government | 3.00 in 2039 | 2.60 | 102.8 | 108.4 | 211.2 | 707 |
Source: Production and cost forecasts by Antonio de Pinho. Total cash outlay includes operating as well as capital expenditure. Outlay and revenue are cumulative to 2040. As of August 2026
Hypothetical scenario analysis based on VanEck assumptions and estimates. For illustrative purposes only. Not a prediction, projection, recommendation or guarantee of future results. Actual results are unknown and are likely to differ materially.
What macroeconomic stabilization program gives Venezuela the best recovery prospects?
The recovery of the oil sector is a necessary condition for the economic recovery of Venezuela, but it is not sufficient. Venezuela suffers from chronic hyperinflation and a decimated nonoil economy. A successful economic program will need to provide an inflation anchor to end hyperinflation and create stability for the nonoil sector to grow again. Because the root cause of Venezuela’s hyperinflation is the government’s monetization of large, persistent fiscal deficits and the resulting loss of trust in the currency, Venezuela needs a credible fiscal and monetary anchor that cannot be altered by the government. For this reason, we model a currency board3 to provide that anchor under US and IMF supervision. Alternatively, we model full dollarization.
A currency board and full dollarization are both economic programs, and both require a government able to implement one, with the fiscal discipline the anchor demands and the backing of the United States, the IMF or both. Neither instrument is available to a government that is monetizing its deficit. That is why we treat political change as a precondition for monetary stabilization rather than as one input among several, and why in our political continuity scenario there is no anchor at all: the monetary base and the exchange rate simply continue to rise together, which is what they are doing now. The bolivar base grew 175% between December 2025 and July 2026 while the currency depreciated 200%. Arresting that requires a change in policy, and a change in policy requires a change in government.
Where a program is possible, the mechanics of a board are straightforward. The peg is not a forecast of where the bolivar will be; it is a policy variable set at the moment of stabilization, relative to the rate prevailing then. We therefore set the peg by rule — 25% weaker than spot at launch — which on a 2027 launch implies about 1,625 to the dollar, a rate that should be re-derived from the spot prevailing at the time. Pegging at or stronger than market invites an immediate reserve drain in defense of a rate the central bank cannot hold; pegging weaker builds in a margin the board can defend, and it is the one design choice every successful board got right.
The decisive question is whether inflation will fall as fast as we model, given Venezuela’s history. It is not a safe bet, because under a fixed peg the gap between domestic and US inflation is real appreciation, and real appreciation is lost competitiveness. A peg only survives if disinflation is fast. The successful boards show why: a credible peg anchors tradables prices directly, so prices converge quickly rather than drifting down over a decade. Bulgaria pegged in mid-1997 and printed 19% inflation the following year and under 3% inflation the year after. Estonia is the slow case and it still reached single digit inflation in about six years. We assume the same inflation path for Venezuela, with 80% in 2027 as the pre-peg carry works through, 22% in 2028, single digits from 2030 and roughly 3.5% at the end of the horizon.
A gradual disinflation reaching only the low teens by 2034 raises the domestic price level roughly 48 times against a peg that does not move, leaving Venezuelan output some thirty times more expensive relative to its competitors than it is today. In that scenario, non-oil exports would cease to exist and the peg would break well before 2034.
Hyperinflation destroyed Venezuelan money demand, and successful stabilization would bring it back. Re-monetization is the central monetary dynamic of a currency board’s first decade, and Estonia and Bulgaria both roughly doubled base money as a share of GDP. We model the same doubling, from an observed 1.9% of GDP to 3.8% by 2034, which is conservative: it leaves Venezuela below the level at which Bulgaria began, and well under the 8% to 15% typical of a functioning economy. Even so the backing ratio never falls below about eight times, far more cover than any currency board needs, which is a reminder that the binding constraint on this program is fiscal rather than monetary.
Non-oil output responds to the oil recovery at an elasticity of 0.10, applied to oil revenue growth on top of a scenario-specific base path. The empirical literature on oil exporters gives impulse responses rather than a single coefficient, and finds the transmission runs through government spending, with a larger response where the state is large relative to the non-oil economy. Venezuela fits that description, which argues for the upper end of the 0.05 to 0.10 range those studies imply. We apply it as a single same-year coefficient rather than as a dynamic response, which front-loads the non-oil recovery relative to what the literature finds.
Table 3. Macroeconomic projections under the currency board — Scenario 2
| 2025 | 2026 | 2027 | 2028 | 2030 | 2032 | 2034 | |
| Real GDP growth (%) | −3.7 | 2.7 | 3.2 | 5.2 | 5.0 | 4.1 | 2.9 |
| Nominal GDP (USD bn) | 98 | 106 | 110 | 117 | 131 | 148 | 164 |
| Headline CPI inflation (%, eop) | 475 | 500 | 80 | 22 | 6 | 4 | 4 |
| Exchange rate (Bs/USD, eop) | 296 | 1,300 | 1,625 | 1,625 | 1,625 | 1,625 | 1,625 |
| Oil production (mn bbl/d) | 0.95 | 1.10 | 1.20 | 1.35 | 1.60 | 1.82 | 1.95 |
| Brent (USD/bbl) | 70 | 88 | 79 | 74 | 71 | 71 | 71 |
| Realized export price (USD/bbl) | 58 | 76 | 67 | 62 | 59 | 59 | 59 |
| Exports of goods and services (USD bn) | 21 | 31 | 30 | 32 | 36 | 41 | 44 |
| Current account (% of GDP) | 9.2 | 17.5 | −3.5 | −0.1 | 5.9 | 10.7 | 11.4 |
| Government revenue (USD bn) | 17 | 22 | 23 | 26 | 30 | 34 | 37 |
| Primary balance (% of GDP) | 2.6 | 4.5 | 3.2 | 3.1 | 2.8 | 2.7 | 2.4 |
| FX reserves (USD bn, eop) | 23 | 32 | 35 | 39 | 54 | 69 | 89 |
| Reserves / monetary base (x, ≥ 1.0) | 5.9 | 7.7 | 8.0 | 8.4 | 10.4 | 11.7 | 13.6 |
Scenario 2, a legitimate election won by the incumbent, with production reaching 1.95 mn bbl/d by 2034. Brent is realized through 2025, then the Bloomberg annual forward curve to 2030 held flat thereafter; Venezuela’s realized export price is Brent less a flat $12 Merey differential. The anchor launches in 2027 and the exchange settles on 30 June 2028.
Hypothetical scenario analysis based on VanEck assumptions and estimates. For illustrative purposes only. Not a prediction, projection, recommendation or guarantee of future results. Actual results are unknown and are likely to differ materially.
Source: VanEck, As of August 2026.
Would full dollarization be better?
The alternative is to abandon the bolivar entirely. Venezuela is already de facto dollarized and Venezuelans have shown a clear preference for dollars. Formalization would attract investment and create an anchor harder to reverse than a board’s.
Dollarization is affordable, and the reason is that Venezuela’s bolivar money stock is tiny in dollar terms. The monetary base stood at Bs 1.46 trillion at the end of July 2026, which is about $1.95bn, or just 1.9% of GDP. Its composition matters as much as its size: only 6% is currency in circulation, and 94% is bank deposits held at the central bank due to Venezuela’s severe reserve requirement.4 Converting in 2027 at 1,625 to the dollar — the same rate as the board’s peg, so the two programs are compared on identical terms — the government must redeem about $1.8bn. That is 5% of reserves and under 2% of GDP, and it leaves well over six months of import cover. Re-monetization does not arise here. Under a board the bolivar survives, money demand recovers over time, and the board must back a growing base with reserves. Dollarization extinguishes the bolivar at conversion: confidence arrives with the dollar rather than being rebuilt in a domestic currency, and the money stock the public accumulates afterwards is dollars earned through the balance of payments rather than a liability the state must redeem. The only recurring cost is the seigniorage forgone on the reserves spent at conversion, about $0.08bn a year, under a tenth of a percent of GDP.
The conversion rate, not the reserve stock, determines affordability: redeeming a fixed bolivar base costs $4.9bn at 300 to the dollar and $1.5bn at 1,000. Ecuador chose 25,000 sucres rather than 20,000 because reserves would not have covered its sucre liabilities at the stronger rate.5,6
Because the base and the exchange rate rise together, the base measured in dollars is flat to shrinking — it fell 8% over the same period. The cost of redeeming it is therefore close to invariant to how far the currency collapses before stabilization arrives. Delay does not price this option out of reach.
Table 4. Currency board against full dollarization
| Currency board | Full dollarization | |
| One-off liquidity call | None | $1.8bn buyback — 5% of reserves |
| Recurring cost | None | $0.08bn p.a. forgone seigniorage |
| Reserves tied up in the money stock | $6.4bn by 2034, encumbered | Earned through the balance of payments |
| Credibility | Reversible by legislation | Effectively irreversible |
| Lender of last resort | Excess reserves can be deployed | Requires a pre-funded facility |
| Adjustment to an oil shock | Peg can break — disorderly | Wages and spending — grinding |
| Legal requirement | Central bank law | National Assembly must change legal tender |
| Precedents | Estonia, Bulgaria, Argentina | Panama, Ecuador, El Salvador |
Source: VanEck, as of August 2026
Two conditions are not financial. The bolivar is the sole legal tender under current law, so formal adoption requires the National Assembly to act, which means dollarization is only available if there is political will and US backing. Also, a dollarized economy has no lender of last resort, so the banking system needs a standing liquidity facility. The precedents built these from bank contributions rather than state reserves — Ecuador required banks to contribute 1% of deposits a year, reaching 3% of system assets over two decades, while El Salvador relied on banks holding more liquid assets and Panama has never had one. On Venezuela’s deposit base a comparable fund is about $60m, so it adds nothing material to the cost of conversion, though the case for building it sooner is that Venezuela has neither Panama’s foreign bank parents nor El Salvador’s healthy starting system.
One point worth specifying is that bolivar debt does not have to be repurchased, only base money does, because currency and bank reserves are demand liabilities the central bank must extinguish for dollars, and that is the $1.8bn above. Bolivar-denominated contracts are redenominated instead, converted into dollars at the conversion rate by operation of law, as El Salvador did at 8.75 colones. No cash changes hands.
For Venezuela the question barely arises, and that favors dollarization. Hyperinflation has already destroyed the real value of the domestic bond stock, and the government finances itself by printing rather than by issuing bolivar paper, so there is almost nothing left to convert. The standard objection to dollarization is that redenomination turns an inflatable domestic liability into a hard-currency one the government must earn dollars to service. Ecuador and El Salvador both had real domestic debt stocks when they converted. Venezuela does not.
Two consequences do follow. Bank deposits above the monetary base, roughly $0.9bn, are redenominated too, which is neutral if banks hold bolivar assets against bolivar deposits and painful if they do not — and with surplus reserves at 0.4% of the base there is no buffer to absorb a mismatch. And the conversion rate is an implicit haircut on domestic creditors as well as the price of the buyback: a weaker rate shrinks the dollar value of every redenominated claim, wage and deposit. Ecuador at 25,000 sucres imposed a large real loss on domestic holders.
The choice between a currency board and dollarization is not too important to bondholders, as the key repayment risk remains the same — Venezuela needs sufficient dollar revenues to repay the bonds. A more credible economic program would lower the risk of a future default, but the evidence for dollarization being better for repayment is weak: Ecuador dollarized in 2000 and restructured in 2008 and again in 2020; El Salvador dollarized in 2001 and reached distress in 2022. Dollarization does not guarantee credit worthiness.
What dollarization does deliver for creditors is the removal of a specific failure mode. Under a currency board, a financing gap forces a choice between breaking the peg and defaulting again; under dollarization there is no peg to break, so a shortfall shows up as arrears or spending cuts rather than as a currency collapse on top of a restructuring.
These projections assume the anchor holds, and every currency board that has failed did so because a government found the fiscal gap easier to monetize than to close. Venezuelan governments have historically found that route appealing, which strengthens the argument for dollarization, since it removes the option.
How big a haircut does Venezuela need?
Under the market access framework the answer is set by three tests. Sri Lanka’s program was anchored on public debt below 95% of GDP by 2032, gross financing needs below 13% of GDP on average, and foreign currency debt service below 4.5% of GDP in every year. We apply a 70% debt anchor, a 6% financing needs ceiling and a 7% foreign currency service ceiling, the last two calibrated to Venezuela rather than imported. The service ceiling is calibrated to Venezuela’s export capacity: 7% of GDP is 26% of Venezuelan exports, compared with the 30% of exports Sri Lanka’s own 4.5% ceiling represented. It remains the more conservative of the two on the measure the Fund used. The financing needs ceiling is set at 6% because the range across recent programs tracks the depth of the domestic debt market: Sri Lanka needed 13% to roll a large Treasury bill stock, while Argentina was held to 5% and Ecuador to 6%. Venezuela has no domestic bond market at all, hyperinflation having destroyed it, so it belongs at the Ecuador end. In practice the test does not bind, because with nothing domestic to roll Venezuela’s financing need is close to its external debt service, and satisfying the service ceiling satisfies this one too.
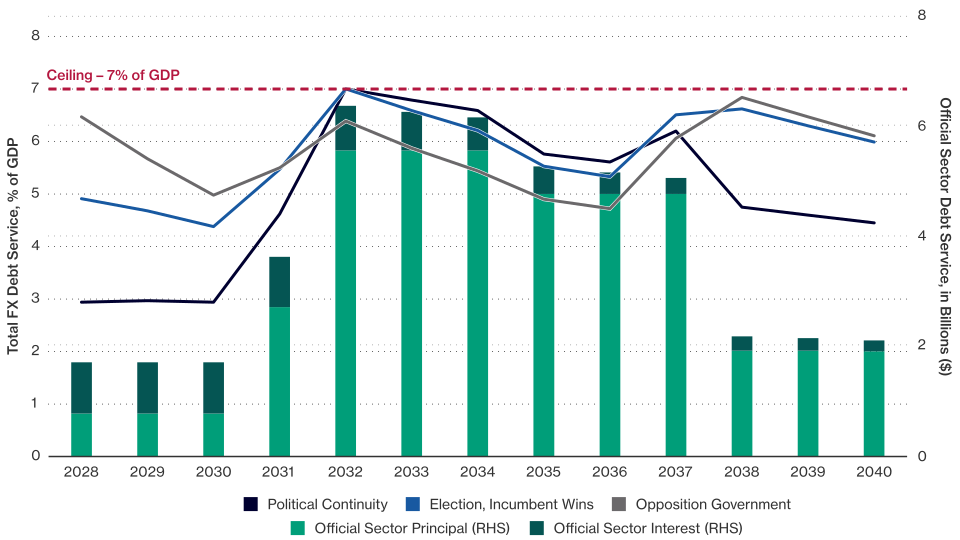
The binding test is not the debt anchor. It is foreign currency debt service, and it binds because of the senior creditor stack rather than the bonds. The IMF and the multilaterals begin amortizing in 2032 and finish in 2037, and the reprofiled bilateral claims join a year earlier. Across that window senior debt service alone reaches 5.7% of GDP under political continuity, 4.3% if the incumbent wins and 3.2% under an opposition government. Outside 2032 to 2036 there is ample room. The constraint is therefore five years of elevated debt service driven by the amortization profile, not a permanent feature of the debt stock.
Under political continuity the senior stack absorbs almost the whole ceiling on its own, which is why the required haircut reaches 83% while the debt stock ratio sits at 54% against a 70% anchor. Continuity fails on liquidity rather than solvency, and only official sector reprofiling can fix it.
The constraint is five years of elevated debt service
Bars show what Venezuela owes the official sector; service peaks while the IMF and multilaterals amortize
Source: IMF, VanEck, As of August 2026.
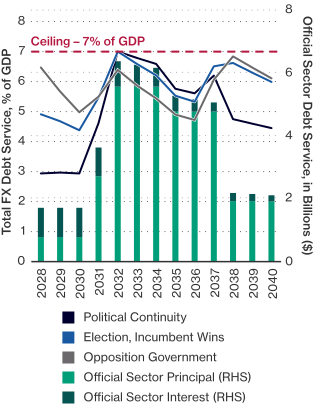
Chart 1. Lines show total post-restructuring foreign currency debt service against a ceiling of 7% of GDP, calibrated to Venezuela’s export capacity. Bars show annual principal and interest owed to the official sector, on the right axis, and are common to all three scenarios. Official service peaks at $6.4bn in 2032 as the IMF and the multilaterals begin amortizing, then falls back once they are repaid. The exchange package carries principal grace across that window so that bond amortization does not compound it; the later steps in 2037 and 2040 are the coupon step-up and the start of bond amortization, both of which clear the ceiling.
Hypothetical scenario analysis based on VanEck assumptions and estimates. For illustrative purposes only. Not a prediction, projection, recommendation or guarantee of future results. Actual results are unknown and are likely to differ materially.
Two of these three tests are framework standard and one is not. The debt stock anchor and the financing needs ceiling appear in every recent market-access program: Argentina’s 2020 restructuring was assessed against financing needs of 5% of GDP and foreign currency debt service of 3%, and Ukraine’s 2024 arrangement targets public debt of 82% of GDP by 2028 and 65% by 2033 with financing needs averaging 8%. The flow test varies in both level and form. Sri Lanka caps foreign currency debt service at a level, while Ukraine specifies the relief creditors must deliver, at 1 to 1.8% of GDP a year. We use the Sri Lanka form because it is the closer analogue for a commodity exporter, but it is a judgment the official sector will make case by case and cannot be known in advance.
That need for judgement provides bondholders room to negotiate. The Fund’s own stated basis for setting the ceiling is the borrower’s ability to generate and sustain foreign currency earnings, and under an opposition government Venezuela’s oil exports roughly double between 2028 and 2034. A ceiling fixed as a share of GDP does not reflect that, and the argument for a looser one strengthens as the oil sector grows. The upside for bondholders is unevenly distributed: a looser ceiling is worth little under an opposition government, where the debt anchor takes over as the binding test, and a great deal under the weaker outcomes.
Table 5. Required haircut and recovery, and the cost of a larger official program
| Scenario | Haircut (%) | Binding test | New bonds | Warrant | Recovery | At $18bn |
| S1 Political continuity | 83.4 | FX debt service | 15.6 | — | 15.6 | 0.0 |
| S2 Election, incumbent wins | 53.8 | FX debt service | 50.0 | 4.1 | 54.1 | 34.9 |
| S3 Opposition government | 26.3 | Debt stock | 92.8 | 6.9 | 99.7 | 95.0 |
Percent of the $111.2bn eligible claim, and recovery per $100 of face, under a $10bn official program and the exchange terms set out below. Market price 50.9. The warrant attaches above the oil revenue delivered under political continuity, so it pays nothing in the scenario the haircut is calibrated against and increasing amounts as production exceeds it. The final column shows total recovery on an $18bn program instead.
Hypothetical scenario analysis based on VanEck assumptions and estimates. For illustrative purposes only. Not a prediction, projection, recommendation or guarantee of future results. Actual results are unknown and are likely to differ materially.
Source: VanEck, as of August 2026.
Under an opposition government the debt anchor is the binding constraint. The spread between scenarios is enormous: a haircut of 26% under an opposition government against 83% under continuity, driven by nothing other than the oil production path and the GDP it delivers.
How large a program should the official sector provide?
Table 6. What Venezuela could access, and what comparable countries received
| Basis | % of quota | Actual ($bn) | Venezuela equivalent ($bn) | Note |
| IMF annual access limit | 200 | — | 10.1 | Raised from 145% in March 2023 |
| IMF cumulative limit, normal access | 600 | — | 30.4 | Raised from 435%; the practical ceiling |
| Ecuador 2020 — exceptional access | 661 | 6.5 | 33.5 | Post-default, dollarized economy |
| Argentina 2018 — exceptional access | 1,277 | 57.0 | 64.7 | Largest program in Fund history at the time |
| Greece 2012 — exceptional access | 2,159 | 28.0 | 109.4 | The outer bound of what has ever been done |
| Our base assumption | 197 | — | 10.0 | Inside the annual access limit |
Percentages are of each country’s own quota. The actual column gives what that country received; the Venezuela equivalent applies the same percentage to Venezuela’s quota of SDR 3,722.7mn. Ecuador’s 2020 arrangement was $6.5bn on a much smaller quota, which is why an identical percentage translates to $33.5bn here.
Source: IMF, VanEck, as of August 2026.
The historical comparison that matters most, though, is not the size of recent emergency programs but the size of programs that accompanied the kind of monetary anchor we are proposing. Those were strikingly small. Ecuador’s dollarization in January 2000 was supported by a stand-by arrangement of roughly $300m against a $19bn economy, which was under two percent of GDP. Bulgaria’s currency board in 1997, Estonia’s in 1992, Lithuania’s in 1994 and Argentina’s convertibility plan in 1991 were all similarly modest. The reason is instructive: a hard anchor derives its credibility from irreversibility and fiscal discipline, not from the quantity of official money standing behind it. Large programs are what countries receive when they are trying to defend an anchor they cannot make credible by other means.
Applying that logic to Venezuela suggests a smaller program could be sufficient. The Fund finances balance of payments gaps, and under either election scenario Venezuela’s current account is in surplus once oil recovers. The dollarization buyback is $1.8bn against reserves that already exceed $30bn. Our fiscal projections show the overall balance positive from 2028 to 2031 and negative only from 2032, and that later gap is caused by senior amortization rather than by the cost of stabilizing. Nothing in the stabilization itself requires a large program.
Venezuela does need large scale investment, but very little from the IMF. Reconstruction after the June 2026 earthquakes is a World Bank, Inter-American Development Bank and donor matter, and the oil sector needs $138bn to $211bn of cash outlay depending on the political outcome, from the private sector. Confusing those needs with the Fund’s balance of payments role would be expensive for bondholders, because the Fund’s money is senior and the private sector’s is not. The right architecture is a modest Fund program of perhaps $8bn to $12bn, concessional multilateral lending for reconstruction, and private capital for the oil sector.
The final column of Table 5 sets out the effect. Moving from a $10bn program to $18bn costs sixteen points of recovery under political continuity and nineteen if the incumbent wins, against five under an opposition government. The package bites hardest on the outcomes that can least afford it.
An incumbent win recovers 54.1 on our $10bn base, but no longer provides upside once the official program reaches about $11bn, so the scenario is almost fully priced. The investment case therefore rests on an election taking place and on the official sector keeping its own program modest, rather than on which side wins. A bondholder in this credit is, whether they realize it or not, taking a view on how generous the official sector intends to be as much as on Venezuelan politics.
What kind of exchange bond package makes sense?
The design of the exchange package matters more than the framework. The LIC concessional framework measures the present value of debt discounted at 5%, so a creditor wants the package delivering the most market value per unit of present value charged against the envelope, which means front-loaded cash and shorter maturities. The market access framework measures debt service in dollars, with no discounting in the constraint at all, so a creditor wants a package that moves cash out of the years where the ceiling binds.
In our model the two approaches diverge sharply. Under the concessional framework at a medium debt carrying capacity classification, with a package built for a present value test, an opposition government recovers 42.3 per $100 of face. Under the market access framework at a 70% anchor, with a package built for a service test, it recovers 99.7. The difference is not the instrument but the test: a present value threshold of 40% of GDP is far tighter than a nominal anchor of 70%, because the two measure different quantities. A bondholder therefore has a great deal riding on which framework applies, and on the election that determines the GDP path underneath it.
Under the MAC framework, because the constraint is five years of elevated service rather than a permanent ceiling, what matters is moving principal out of 2032 to 2036 rather than reshaping the coupon. A conventional structure does this cleanly: a 5% coupon stepping to 8% from 2037, with ten years of principal grace so that bond amortization begins only after the coupon steps up, and a twelve year repayment thereafter. That grace period sits at the top of the range in the recent emerging-market exchanges rather than beyond it, since Ecuador ran to ten years and Argentina and Ukraine to between four and seven. That is a market-access design; under the concessional framework the reverse applies, and shorter maturities with front-loaded cash deliver more value per unit of present value charged.
Table 7. Exchange terms under the market access framework
| Structure | Coupon to 2036 | From 2037 | Principal grace | Price at 9% | Haircut | Recovery |
| Conventional step-up, no grace | 1.25% | 5.0% | none | 0.526 | 24.8 | 75.0 |
| Conventional step-up with grace | 5.0% | 8.0% | 10 yrs | 0.731 | 26.3 | 99.7 |
Recovery per $100 of face, opposition scenario, $10bn official program. Market price 50.9. Both structures carry the oil revenue warrant described below.
Hypothetical scenario analysis based on VanEck assumptions and estimates. For illustrative purposes only. Not a prediction, projection, recommendation or guarantee of future results. Actual results are unknown and are likely to differ materially.
Source: VanEck, as of August 2026.
The grace period does almost all of the work. Amortization is the larger part of debt service in the binding years, so deferring principal relieves the constraint while a coupon reduction would surrender value the market prices at the exit yield. Deferring principal and paying a fuller coupon raises recovery from 75.0 to 99.7, on a haircut that barely moves.
The package also carries an oil revenue warrant, which pays when annual oil revenue exceeds a fixed dollar baseline. That is the closest analogue to the Argentine and Ukrainian GDP warrants, and it avoids the obvious trap: a pure price trigger ignores the volume recovery that is the whole point of the reform case. It attaches above the oil revenue delivered under political continuity rather than at a fixed level, which is how the Argentine and Ukrainian GDP warrants were built: the instrument compensates creditors for accepting a haircut calibrated on a pessimistic path if the path turns out better. It contributes about seven points under an opposition government and four if the incumbent wins, and nothing under continuity by construction.
How to value the exchange bond package? Exit yields and time to secondary trading
Valuation of the exchange package requires three additional considerations. The first is the exit yield at which the new bonds trade. The second is the claim-to-face multiplier, which reflects how much past-due interest each bond has accrued relative to its principal and therefore how much of the new package it receives. The third is the discount from the assumed 2028 exchange date back to today, which is the cost of the time it takes to reach secondary trading.
On exit yields we use scenario-linked assumptions: 12.0% under political continuity, 10.5% if the incumbent wins a legitimate election and 9.0% under an opposition government, with PDVSA at plus 200 basis points and ELECAR at plus 250 basis points. These spreads are assumptions based on historical quasi-sovereign relationships. If the oil sector gets privatized, the new role of PDVSA in the economy could lead it to trade at a very different spread to sovereign.
The claim-to-face multiplier averages about 1.95 across the twenty-four defaulted bonds we track, and it varies materially: an old, high-coupon bond has accrued far more past-due interest per dollar of principal than a long-dated, low-coupon one, and under the standard exchange-ratio convention it receives a proportionately larger package.
The third component is simply time. We discount the 2028 package back to today at a single rate of 9% to represent the opportunity cost of high-yield capital. Past-due interest is accrued to the exchange date, so the claim on which the package is sized and the claim used to express recovery per unit of original face are measured on the same date. The three combine into the package price used throughout: discounting the recommended terms at the scenario exit yield gives 0.731 per unit of face, against 0.526 for the same structure without the principal grace, and it is that difference rather than the haircut that separates a recovery of 99.7 from one of 75.0.
Putting the three together gives recovery per $100 of face of 15.6 under political continuity, 54.1 if the incumbent wins and 99.7 under an opposition government, against a market price of 50.9. Only an opposition government provides material upside. An incumbent win is close to fairly priced, with just three points of upside, and it no longer provides upside once the official program reaches about $11bn.
Weighting the three outcomes to reconcile to 50.9 implies a 38% probability of political continuity, 38% for an incumbent win and 25% for an opposition government. Continuity is the only outcome that loses money at this price, so the risk a buyer is taking is not a particular winner but an election of some kind, which the market puts at just over 60%. On an $18bn program, only an opposition government provides bondholders upside, and the market would need to price that at 43%, so the judgment a bondholder is making is as much about official sector restraint as about Venezuelan politics.
Table 8. Recovery by obligor under each scenario
| Obligor | Claim / face | Exit yield S3 (%) | S1 | S2 | S3 | Market | S3 upside (%) |
| Republic | 2.05 | 9.0 | 16.5 | 57.1 | 105.0 | 50.9 | +106 |
| PDVSA | 1.82 | 11.0 | 12.3 | 42.7 | 77.5 | 41.2 | +88 |
| ELECAR | 1.91 | 11.5 | 12.4 | 43.2 | 78.1 | 37.8 | +107 |
Recovery per $100 of face on a $10bn official program, at the exchange terms set out above. PDVSA is priced 200bp and ELECAR 250bp over the sovereign exit yield, assumptions based on historical quasi-sovereign relationships. Claim per unit of face differs because the obligors coupons and the interest accrued since the last payment before the November 2017 default differ. S3 upside is scenario 3 recovery against the current market price. Oil price and bond price inputs as of 25 August 2026.
Hypothetical scenario analysis based on VanEck assumptions and estimates. For illustrative purposes only. Not a prediction, projection, recommendation or guarantee of future results. Actual results are unknown and are likely to differ materially.
Source: VanEck, Bloomberg, as of August 25, 2026.
The ranking by upside is not the ranking by price. PDVSA is the cheapest of the three on headline price but the least attractive relative to it, because a lower claim per unit of face and a wider exit spread both work against it. ELECAR trades lowest of all and carries essentially the same upside as the Republic but is less liquid.
Backing the implied haircut out of the market price makes the same point from the other direction. To justify 50.9 the market is assuming a nominal haircut of roughly 65%, against the 26% our analysis requires under an opposition government and 54% under an incumbent win. The market is therefore pricing an outcome slightly worse than an incumbent win would deliver, which leaves modest upside in that scenario and substantial upside under an opposition government.
What are the obstacles to completing the envisioned restructuring? What can go wrong?
Oil production
The most important risk to our scenarios is the oil production forecast. If the required investment never materializes, recovery values are significantly lower. Politics transmits directly: while legal uncertainty over property rights and government take remains, oil companies will invest only what they expect to recoup from near term production. That is why legitimate elections matter to the outlook — without them, the legality of any oil sector legislation remains in doubt.
Elections also affect how generous foreign lenders will be. Market access remains limited without them, and the official sector will set more stringent conditions and the US may not even remove sanctions without them.
In the most extreme downside there is the scenario of social unrest and the absence of a functioning government. Restructuring would be delayed for many more years and recovery could be lower still.
Creditor resistance
Conflict between stakeholders during creditor negotiations can also create delays and lead to additional subordination of bondholders. For geopolitical reasons, China may not be willing to provide large NPV relief. Prior to US involvement, Venezuela was current on its debt to China and was paying China with heavy crude, which China needs. While unlikely, Russia could attempt to be included in senior creditor claims. The official sector could determine that Venezuela needs a much larger IMF program and that additional senior debt leaves very little recovery value for junior creditors. The bondholder creditor committee likely owns a large enough position to block unfavorable restructuring terms. However, if the US government and the Venezuelan government are not aligned with bondholders and would prefer a larger aid package at the expense of creditor recoveries, the IMF could choose to lend in arrears and by doing so strip bondholders of a lot of their negotiating power.
The judgment creditors are the other source of friction, and they are structurally advantaged. No collective action clause binds an arbitral award, and the attachment liens are satisfied by date rather than pro rata. The Delaware process illustrates the point: of roughly $20bn of attached claims, only about $5.5bn was satisfied by the approved sale. Judgment creditors were crammed at bond-level haircuts in only one comparable case, Iraq in 2006, and only because a United Nations Chapter VII resolution had stripped their enforcement leverage entirely. Absent something equivalent, we should expect this class to recover above bondholders.
Market pricing
At current bond prices, the market assigns a modest likelihood to a favorable combination of electoral outcome and oil production. On our grid, a price of 50.9 is consistent with material upside only under an opposition government. The incumbent case is almost fully priced, and turns negative above an $11bn official program. For this reason, the EM active team has no position in Venezuelan bonds and waits for a better entry point or more clarity on the electoral timeline.
The purpose of running the debt sustainability analysis under three scenarios was to establish the boundaries of a potential recovery range.
Appendix
Venezuela against the precedents
Iraq in 2006 is the closest analog on the dimensions that matter: an oil-dominated economy, sixteen years of arrears, a political reset, full recognition of past-due interest and an 89% commercial haircut. Zambia in 2024 is the template for how the official sector will be treated. Argentina in 2005 is the warning about holdouts.
One comparison in that table invites an objection worth meeting directly. Zambia’s debt-carrying capacity was assessed as weak — its composite indicator has printed between 2.58 and 2.62 through 2024 and 2025, below the 2.69 cutoff throughout — and yet its bondholders took a nominal haircut of only 23%. If a weak classification is compatible with a 23% haircut in Zambia, why does Venezuela require 26% even under an opposition government, and 83% under continuity? The answer is not the classification but the distance from it. Zambia’s present value of external debt to GDP averaged around 40% against a 30% threshold, a gap of roughly ten percentage points closing over a decade. Venezuela’s is 236% against the same threshold.
| Venezuela (model) | Argentina 2005 | Iraq 2006 | Zambia 2024 | |
| Default → deal | 2017 → 2028 (assumed) | 2001 → 2005 | 1990 → 2006 | 2020 → 2024 |
| Years in arrears | ~11 | 3.5 | ~16 | 3.5 |
| Eligible claim ($bn) | 111.2 | ~82 | ~52 | 3.98 |
| Debt / GDP at deal | ~180% | ~150% | >400% | ~110% |
| Nominal haircut | 72–98% | 66% | 89% | 23% |
| NPV haircut | 57–90% | ~73% | ~89–93% | ~40% |
| Past-due interest | 100% capitalized | 100% capitalized | 100% recognized | 100% recognized |
| Value recovery instrument | Oil revenue warrant | GDP warrant | None | State-contingent coupon |
| Official bilateral nominal cut | Zero — reprofiling only | Paid in full 2014 | ~80% NPV | Zero — reprofiling only |
| Comparability passed to bonds? | 50% clawback assumed | No | Yes | Yes — on the second attempt |
| Holdout / litigation risk | Severe — no CACs, $31bn awards | Severe — 14-year saga | Limited — Ch. VII | Limited — single-limb CACs |
| Debt carrying capacity | Weak | Market access | Market access | Weak |
Bond claims by obligor
The bond claim is the reference class for the exchange. Principal, past-due interest and total claim are shown separately; the exchange ratio applies to the total claim. Coupons are principal-weighted.
| Obligor | Principal | Past-due interest | Total claim | Wtd. coupon (%) | Note |
| VENZ sovereign | 31.1 | 32.7 | 63.8 | 9.73 | Republic obligation; pari passu clause |
| PDVSA | 25.4 | 20.8 | 46.2 | 7.42 | Separate obligor, not cross-pari with the sovereign |
| ELECAR | 0.7 | 0.6 | 1.2 | 8.50 | Separate obligor; smallest of the three |
| Eligible claim at the 2028 exchange | 57.1 | 54.0 | 111.2 | 8.69 |
USD bn. Past-due interest accrued from the last coupon paid before the November 2017 default to the 30 June 2028 exchange — 10.6 to 11.1 years — on an ISMA 30/360 basis at each bond’s stated coupon. Claim-to-face is therefore 1.95x. Excludes the secured PDVSA 2020 8.5% bond.
Source: VanEck research, As of August 2026.
To receive more Emerging Markets Bonds insights, sign up in our subscription center.

IMPORTANT DISCLOSURES
1 Crystallex International Corp. v. Bolivarian Republic of Venezuela, 333 F. Supp. 3d 380 (D. Del. 2018), permitting attachment of PDVSA shares in PDV Holding to satisfy a sovereign award.
2 PDVSA v. MUFG Union Bank, N.A. (S.D.N.Y. 2025): Judge Katherine Polk Failla held that the 2020 Bonds were validly issued under Venezuelan law and that the act of state doctrine did not extend to the National Assembly resolutions PDVSA relied on. Appeals were filed. Enforcement against the CITGO collateral remains gated by OFAC, which has repeatedly extended the delay in General License 5 — most recently through General License 5X of 18 June 2026 — while confirming it will not pursue holders who take steps to preserve their rights. In the Delaware sale process the recommended bid included a $2.125bn payment to the 2020 holders.
3 The stabilization programs we draw on are Estonia (1992, currency board at 8 kroon to the Deutsche Mark), Bulgaria (1997, currency board following the banking collapse), Bosnia and Herzegovina (1997), and Argentina (1991 Convertibility Plan). All launched at or weaker than the prevailing market rate. Argentina is also the cautionary case: the peg held inflation down for a decade but broke in 2001 when fiscal discipline failed, which is why we pair the board with an external fiscal anchor rather than treating the peg as sufficient on its own.
4 Monetary base and composition from Bloomberg series VNMBMONE and VNMBCUCI, sourced from the Banco Central de Venezuela weekly report; base of Bs 1.457trn at 31 July 2026. Exchange rate Bloomberg VES BGN, 745.62 at the same date.
5 Ecuador dollarized on 9 January 2000 at 25,000 sucres per dollar, covering the whole monetary base — currency in circulation, bank deposits and current accounts. IMF Country Report 00/125 records that at 20,000 sucres the available foreign exchange would not have covered the central bank’s sucre liabilities, and that a more appreciated rate risked a speculative attack and deposit flight before the new arrangements were in place. Sucre notes remained exchangeable at the Banco Central until 30 March 2001.
6 El Salvador’s Ley de Integración Monetaria, approved 30 November 2000 and effective 1 January 2001, fixed the colón at 8.75 per dollar and obliged the Banco Central de Reserva and the banking system to exchange colones for dollars on demand. Unlike Ecuador this was not a crisis measure: the nominal rate had been stable near 8.78 since 1993, though the currency had still appreciated about 50% in real terms over that period — a reminder that a stable nominal peg does not prevent real appreciation. The colón has never formally ceased to be legal tender; it simply stopped circulating.
Please note that VanEck may offer investment products that invest in the asset class(es) or industries included herein.
This is not an offer to buy or sell, or a recommendation to buy or sell any of the securities, financial instruments or digital assets mentioned herein. The information presented does not involve the rendering of personalized investment, financial, legal, tax advice, or any call to action. Certain statements contained herein may constitute projections, forecasts and other forward-looking statements, which do not reflect actual results, are for illustrative purposes only, are valid as of the date of this communication, and are subject to change without notice. Actual future performance of any assets or industries mentioned are unknown. Information provided by third party sources are believed to be reliable and have not been independently verified for accuracy or completeness and cannot be guaranteed. VanEck does not guarantee the accuracy of third-party data. The information herein represents the opinion of the author(s), but not necessarily those of VanEck or its other employees. The information, valuation scenarios and price targets presented for Venezuelan sovereign, PDVSA and ELECAR bonds in this paper are not intended as financial advice, a call to action, a recommendation to buy or sell these bonds, or a projection of how these bonds will perform in the future. Actual future performance of these bonds is unknown and may differ significantly from the hypothetical results depicted herein. There may be risks or other factors not accounted for in the scenarios presented that may impede the performance of these bonds. These hypothetical results are based solely on simulations derived from our research, are valid as of the date of this communication and subject to change without notice, and are for illustrative purposes only. Please conduct your own research and draw your own conclusions.
There are inherent risks associated with fixed income investing, including interest rate, credit, market, inflation, government policy and liquidity risks. When interest rates rise, bond prices generally fall. Below-investment-grade and distressed debt securities may be more volatile, less liquid, harder to value and subject to greater default risk than higher-rated securities.
Emerging Market securities are subject to greater risks than U.S. domestic investments. These additional risks may include exchange rate fluctuations and exchange controls; less publicly available information; more volatile or less liquid securities markets; and the possibility of arbitrary action by foreign governments, or political, economic or social instability.
Investments in commodities can be very volatile and direct investment in these markets can be very risky, especially for inexperienced investors.
Investments in emerging markets bonds may be substantially more volatile, and substantially less liquid, than the bonds of governments, government agencies, and government-owned corporations located in more developed foreign markets. Emerging markets bonds can have greater custodial and operational risks, and less developed legal and accounting systems than developed markets.
All investing is subject to risk, including the possible loss of the money you invest. As with any investment strategy, there is no guarantee that investment objectives will be met and investors may lose money. Diversification does not ensure a profit or protect against a loss in a declining market. Past performance is no guarantee of future results.
© 2026 Van Eck Associates Corporation.
Related Funds
IMPORTANT DISCLOSURES
1 Crystallex International Corp. v. Bolivarian Republic of Venezuela, 333 F. Supp. 3d 380 (D. Del. 2018), permitting attachment of PDVSA shares in PDV Holding to satisfy a sovereign award.
2 PDVSA v. MUFG Union Bank, N.A. (S.D.N.Y. 2025): Judge Katherine Polk Failla held that the 2020 Bonds were validly issued under Venezuelan law and that the act of state doctrine did not extend to the National Assembly resolutions PDVSA relied on. Appeals were filed. Enforcement against the CITGO collateral remains gated by OFAC, which has repeatedly extended the delay in General License 5 — most recently through General License 5X of 18 June 2026 — while confirming it will not pursue holders who take steps to preserve their rights. In the Delaware sale process the recommended bid included a $2.125bn payment to the 2020 holders.
3 The stabilization programs we draw on are Estonia (1992, currency board at 8 kroon to the Deutsche Mark), Bulgaria (1997, currency board following the banking collapse), Bosnia and Herzegovina (1997), and Argentina (1991 Convertibility Plan). All launched at or weaker than the prevailing market rate. Argentina is also the cautionary case: the peg held inflation down for a decade but broke in 2001 when fiscal discipline failed, which is why we pair the board with an external fiscal anchor rather than treating the peg as sufficient on its own.
4 Monetary base and composition from Bloomberg series VNMBMONE and VNMBCUCI, sourced from the Banco Central de Venezuela weekly report; base of Bs 1.457trn at 31 July 2026. Exchange rate Bloomberg VES BGN, 745.62 at the same date.
5 Ecuador dollarized on 9 January 2000 at 25,000 sucres per dollar, covering the whole monetary base — currency in circulation, bank deposits and current accounts. IMF Country Report 00/125 records that at 20,000 sucres the available foreign exchange would not have covered the central bank’s sucre liabilities, and that a more appreciated rate risked a speculative attack and deposit flight before the new arrangements were in place. Sucre notes remained exchangeable at the Banco Central until 30 March 2001.
6 El Salvador’s Ley de Integración Monetaria, approved 30 November 2000 and effective 1 January 2001, fixed the colón at 8.75 per dollar and obliged the Banco Central de Reserva and the banking system to exchange colones for dollars on demand. Unlike Ecuador this was not a crisis measure: the nominal rate had been stable near 8.78 since 1993, though the currency had still appreciated about 50% in real terms over that period — a reminder that a stable nominal peg does not prevent real appreciation. The colón has never formally ceased to be legal tender; it simply stopped circulating.
Please note that VanEck may offer investment products that invest in the asset class(es) or industries included herein.
This is not an offer to buy or sell, or a recommendation to buy or sell any of the securities, financial instruments or digital assets mentioned herein. The information presented does not involve the rendering of personalized investment, financial, legal, tax advice, or any call to action. Certain statements contained herein may constitute projections, forecasts and other forward-looking statements, which do not reflect actual results, are for illustrative purposes only, are valid as of the date of this communication, and are subject to change without notice. Actual future performance of any assets or industries mentioned are unknown. Information provided by third party sources are believed to be reliable and have not been independently verified for accuracy or completeness and cannot be guaranteed. VanEck does not guarantee the accuracy of third-party data. The information herein represents the opinion of the author(s), but not necessarily those of VanEck or its other employees. The information, valuation scenarios and price targets presented for Venezuelan sovereign, PDVSA and ELECAR bonds in this paper are not intended as financial advice, a call to action, a recommendation to buy or sell these bonds, or a projection of how these bonds will perform in the future. Actual future performance of these bonds is unknown and may differ significantly from the hypothetical results depicted herein. There may be risks or other factors not accounted for in the scenarios presented that may impede the performance of these bonds. These hypothetical results are based solely on simulations derived from our research, are valid as of the date of this communication and subject to change without notice, and are for illustrative purposes only. Please conduct your own research and draw your own conclusions.
There are inherent risks associated with fixed income investing, including interest rate, credit, market, inflation, government policy and liquidity risks. When interest rates rise, bond prices generally fall. Below-investment-grade and distressed debt securities may be more volatile, less liquid, harder to value and subject to greater default risk than higher-rated securities.
Emerging Market securities are subject to greater risks than U.S. domestic investments. These additional risks may include exchange rate fluctuations and exchange controls; less publicly available information; more volatile or less liquid securities markets; and the possibility of arbitrary action by foreign governments, or political, economic or social instability.
Investments in commodities can be very volatile and direct investment in these markets can be very risky, especially for inexperienced investors.
Investments in emerging markets bonds may be substantially more volatile, and substantially less liquid, than the bonds of governments, government agencies, and government-owned corporations located in more developed foreign markets. Emerging markets bonds can have greater custodial and operational risks, and less developed legal and accounting systems than developed markets.
All investing is subject to risk, including the possible loss of the money you invest. As with any investment strategy, there is no guarantee that investment objectives will be met and investors may lose money. Diversification does not ensure a profit or protect against a loss in a declining market. Past performance is no guarantee of future results.
© 2026 Van Eck Associates Corporation.