CNXT ETF: Question & Answer
Read Time 11 MIN
CNXT is a non-diversified, single-country emerging-market fund concentrated in China A-shares of small- and mid-cap companies; it can be highly volatile and you could lose money. Index performance is not illustrative of fund performance. It is not possible to invest directly in an index. Past performance does not guarantee future results.
Click here for CNXT and KWEB standardized performance and all key fund attributes.
The performance data quoted represents past performance. Past performance is not a guarantee of future results. Investment return and principal value of an investment will fluctuate so that an investor's shares, when redeemed, may be worth more or less than their original cost. Performance may be lower or higher than performance data quoted. Please call 800.826.2333 or visit VanEck U.S. - ETF & Mutual Fund Manager for performance current to the most recent month ended.
China's next economic chapter is being written by its private-sector innovators. VanEck ChiNext Innovators ETF (CNXT®) provides access to the 100 largest and most liquid companies listed on the ChiNext Market of the Shenzhen Stock Exchange. This market is built for entrepreneurially driven, R&D-intensive businesses in AI infrastructure, advanced manufacturing, and energy transition, with minimal exposure to state-owned enterprises. This blog answers frequently asked questions about the ChiNext Index and CNXT.
- What is the ChiNext Market?
- How is the ChiNext Market different from the Shanghai main board?
- How is ChiNext different from CSI Overseas China Internet Index tracked by KWEB?
- What type of companies are included in the ChiNext Index?
- What are the top 10 holdings in the ChiNext Index?
- How does ChiNext’s exposure compare to other China benchmarks?
- How correlated is ChiNext Index to global markets?
- How has ChiNext performed relative to other China benchmarks?
- How is the ChiNext index constructed and how often is it rebalanced?
- How to buy VanEck ETFs?
What is the ChiNext Market?
The ChiNext market, operated by the Shenzhen Stock Exchange, was built to list fast-growing companies in strategic emerging industries. ChiNext index’s composition looks structurally different from the rest of China's equity market, with less state-owned enterprise exposure and a heavier tilt toward private, R&D-intensive businesses.
ChiNext companies are:
- Predominantly privately owned, with minimal state-owned enterprise exposure in contrast to the state banks, insurers, and energy conglomerates that dominate the Shanghai main board
- Often founder-led, with a growth-oriented approach to capital allocation and above-average research and development spending relative to the broader market
- Globally competitive niche leaders in categories such as EV batteries, optical transceivers, and solar inverters, whose products are embedded in global supply chains.
The ChiNext board lists companies that are building advanced manufacturing systems, clean energy technologies, medical devices, AI hardware, enterprise software and automation platforms among other forward-looking industries. Many of these companies operate in state policy-supported sectors despite operating as private, market-driven businesses.
How is the ChiNext Market different from the Shanghai main board?
The Shanghai main board is dominated by state-owned banks, insurers, and energy conglomerates that characterize China's old economy. ChiNext is structurally different: it provides targeted exposure to China’s innovative companies in emerging industries such as semiconductors, robotics & A.I., cloud computing, biotech, and clean energy. These are the companies that are driving the country’s transformation into a global innovation powerhouse.
How is ChiNext different from CSI Overseas China Internet Index tracked by KWEB?
When investors think of innovative Chinese companies, they often default to consumer internet names like Alibaba,Tencent, PDD, and Meituan. This is the exposure captured by benchmarks such as the CSI Overseas China Internet Index, tracked by ETFs like KWEB. ChiNext constituents look different from the consumer internet platforms listed in Hong Kong or the U.S. ChiNext’s largest holdings are the companies building the physical and digital infrastructure that underpins China's new economy, spanning AI, electrification, and advanced manufacturing. Whereas CSI Overseas China Internet Index’s holdings are consumer platforms in e-commerce, social media, food delivery, and travel.
Visit the fund page for the fact sheet, holdings, performance and more.
The contrast is clear at the holdings level:
| ChiNext Top 10 | Weight (%) |
| Contemporary Amperex Technology (CATL) | 15.9 |
| Zhongji Innolight | 12.3 |
| Eoptolink Technology | 8.4 |
| East Money Information | 4.2 |
| Suzhou TFC Optical Communication | 2.7 |
| Victory Giant Technology | 2.5 |
| Sungrow Power Supply | 2.3 |
| Chaozhou Three-Circle | 2.1 |
| Shenzhen Inovance Technology | 2.1 |
| Shenzhen Mindray Bio-Medical Electronics | 1.7 |
| CSI Overseas China Internet Index (KWEB) Top 10 | Weight (%) |
| Tencent Holdings | 10.2 |
| Alibaba Group Holding | 8.8 |
| PDD Holdings | 8.2 |
| Meituan Class B | 7.3 |
| NetEase | 6.2 |
| Lenovo Group | 4.9 |
| KE Holdings | 4.5 |
| JD.com | 4.0 |
| Trip.com Group | 3.9 |
| Baidu | 3.3 |
Sources: FactSet and CSI. Data as of 8/31/2026.
What type of companies are included in the ChiNext Index?
The companies included in the ChiNext index are central to what the World Economic Forum has dubbed "Made in China 2.0," an AI-augmented, green-energy-powered, self-reliance-oriented transformation of China's industrial base. Beijing is providing state funding, tax incentives, and targeted programs to foster domestic strength in strategic sectors like solar energy, Electric Vehicles (EVs), humanoid robots, enterprise-grade AI systems, and semiconductors. ChiNext index is composed of these market-driven, predominantly private-sector companies benefiting from both market dynamics and government policy support.
In practice, China’s strategic ambition plays out across two megatrends that define the index: digital transformation and energy transition.
- Digital Transformation: ChiNext index provides access to onshore companies benefitting from China's domestic hardware and digital infrastructure buildout as well as the global AI boom.
- Energy Transition: ChiNext index also provides exposure to the physical infrastructure of electrification. This includes the EV battery supply chain, solar and wind power equipment, EV charging infrastructure, and the critical materials, like rare earths, used in EV motors and wind turbines and batteries.
Together, these two pillars give ChiNext a distinct character: exposure not to the end-consumer brands of China's economy, but to the components, materials, and infrastructure underlying both AI development and the energy transition.
What are the top 10 holdings in the ChiNext Index?
ChiNext's largest holdings are concentrated in the companies supplying the physical building blocks of digital transformation and energy transition. It provides targeted exposure to the components, materials, and infrastructure that AI buildouts and electrification depend on.
Optical connectivity and semiconductor names supporting the AI infrastructure buildout anchor the top of the index. Alongside EV battery and solar equipment manufacturers, these companies make up more than half of the index's total weight. The index is tilted toward the AI and semiconductor supply chain, with six of its top 10 holdings representing the Digital Transformation theme.
| Name | Weight (%) | Theme Captured |
| Contemporary Amperex Technology (CATL) | 15.9 | Energy Transition — EV battery supply chain |
| Zhongji Innolight | 12.3 | Digital Transformation — AI infrastructure / data center connectivity (optical transceivers) |
| Eoptolink Technology | 8.4 | Digital Transformation — AI infrastructure / data center connectivity (optical transceivers) |
| East Money Information | 4.2 | Financial Technology — online securities and wealth management platform |
| Suzhou TFC Optical Communication | 2.7 | Digital Transformation — AI infrastructure / data center connectivity (optical components) |
| Victory Giant Technology | 2.5 | Digital Transformation — advanced electronics (PCBs for AI servers, data centers) |
| Sungrow Power Supply | 2.3 | Energy Transition — renewable power / solar inverters |
| Chaozhou Three-Circle | 2.1 | Digital Transformation — advanced electronics (ceramic components, optical connectivity) |
| Shenzhen Inovance Technology | 2.1 | Digital Transformation — industrial automation (factory robotics, smart manufacturing) |
| Shenzhen Mindray Bio-Medical Electronics | 1.7 | Medical Technology — patient monitoring, diagnostics, and medical imaging equipment |
Source: CSI Securities. Data as of 8/31/2026.
How does ChiNext's exposure compare to other China benchmarks?
The ChiNext Index includes industries directly tied to China's strategic priorities in AI infrastructure, data connectivity, and industrial automation. Its exposure to high-growth hardware and electronics sectors, such as "communications equipment," "electronic equipment instruments & components," and "electrical equipment," carries a combined weight well above that of the MSCI China Index, MSCI China A Onshore Index, and MSCI Emerging Markets Index.
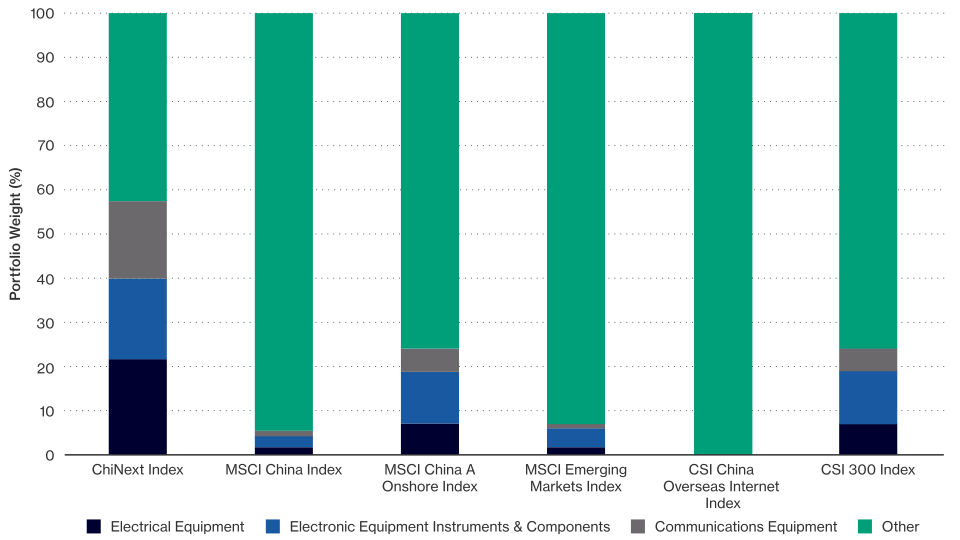
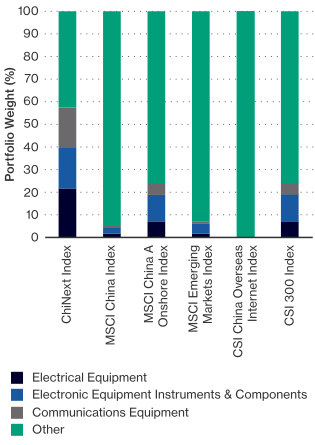
Source: FactSet. Data as of 8/31/2026.
How correlated is ChiNext to global markets?
One of ChiNext's differentiating advantages is its low correlation to major global equity benchmarks. Its concentrated, private-sector, industrial exposure is distinct from the state-heavy or consumer-internet composition of broader China and global indexes.
Over the ten years ended 8/31/2026, ChiNext's monthly returns have moved far more independently of developed-market benchmarks than most other China indexes.
Correlation of Monthly Index Returns (8/31/2016 – 8/31/2026)
| ChiNext Index | MSCI China Index | MSCI China A Onshore Index | CSI Overseas China Internet Index | CSI 300 Index | MSCI EM Index | MSCI ACWI Index | S&P 500 Index | |
| ChiNext Index | 1.00 | |||||||
| MSCI China Index | 0.55 | 1.00 | ||||||
| MSCI China A Onshore Index | 0.88 | 0.74 | 1.00 | |||||
| CSI Overseas China Internet Index | 0.48 | 0.95 | 0.65 | 1.00 | ||||
| CSI 300 Index | 0.83 | 0.79 | 0.98 | 0.70 | 1.00 | |||
| MSCI EM Index | 0.49 | 0.70 | 0.68 | 0.61 | 0.69 | 1.00 | ||
| MSCI ACWI Index | 0.33 | 0.43 | 0.48 | 0.35 | 0.48 | 0.80 | 1.00 | |
| S&P 500 Index | 0.29 | 0.33 | 0.40 | 0.25 | 0.39 | 0.69 | 0.97 | 1.00 |
Source: Morningstar. Data as of 8/31/2026.
For investors with existing developed-market equity allocations, this lower correlation may offer a diversification benefit that broader China or emerging markets exposure may not provide.
How has ChiNext performed relative to other China benchmarks?
ChiNext's structural orientation toward private-sector innovation has translated into competitive performance across multiple time horizons, outperforming a broad field of China equity benchmarks over the past ten years.
ChiNext has led major China indexes over the 1-, 3-, and 5-year periods
| YTD | 1-year | 3-Years | 5-Year | 10-Years | |
| ChiNext Index | 12.43 | 27.38 | 22.49 | 1.52 | 5.34 |
| MSCI China Index | -7.64 | -6.11 | 10.45 | -2.20 | 4.10 |
| MSCI China A Onshore Index | 6.70 | 13.88 | 13.75 | 0.57 | 4.27 |
| FTSE China Incl A 25% Tech Capped Index | -4.79 | -3.74 | 9.31 | -5.72 | 2.54 |
| CSI Overseas China Internet Index | -24.14 | -26.32 | 0.00 | -9.44 | -1.64 |
| CSI 300 Index | 5.65 | 11.67 | 12.93 | 0.93 | 5.66 |
Source: Morningstar. Data as of 8/31/2026.
ChiNext's outperformance is driven by its concentration in companies benefiting from AI infrastructure buildouts, electrification, and industrial upgrading. This stands in contrast to the legacy consumer internet businesses and state-owned enterprises that weigh on the CSI Overseas China Internet Index and MSCI China Index, respectively.
How is the ChiNext Index constructed and how often is it rebalanced?
The ChiNext Index comprises the 100 largest and most liquid A-shares listed and trading on the ChiNext Market of the Shenzhen Stock Exchange.
Index Universe: All companies listed on the Shenzhen Stock Exchange's ChiNext Market are eligible.
Selection Criteria: The bottom 10% of stocks by trading value and market cap are removed from consideration. From the remaining universe, the top 100 companies by total market cap are selected for inclusion.
Position Sizing: No single component stock may represent more than 20% of the index, a cap designed to limit single-name concentration risk even as the index tracks a relatively small, high-growth universe.
Rebalancing: The index is rebalanced semiannually, on the second Friday of June and December.
How to buy VanEck ETFs?


To receive more Emerging Markets Equity insights, sign up in our subscription center.

DISCLOSURES
Quarter End Returns (%) as of 6/30/2026
| Fund Name/Type | Ticker | Investment Objective | Type | 1 Yr | 3 Yr | 5 Yr | 10 Yr | Since Inception | Inception Date | Expense Ratio |
| VanEck ChiNext Innovators ETF | CNXT | VanEck ChiNext Innovators ETF (CNXT) seeks to replicate as closely as possible, before fees and expenses, the price and yield performance of the ChiNext Index (SZ988107), which tracks the performance of the 100 largest and most liquid stocks listed and trading on the ChiNext Market of the Shenzhen Stock Exchange. The ChiNext Index is comprised of China A-shares ("A-shares"). | NAV | 116.91 | 30.32 | 4.74 | 7.37 | 8.99 | 07/23/2014 | Gross: 1.00% |
| VanEck ChiNext Innovators ETF | CNXT | VanEck ChiNext Innovators ETF (CNXT) seeks to replicate as closely as possible, before fees and expenses, the price and yield performance of the ChiNext Index (SZ988107), which tracks the performance of the 100 largest and most liquid stocks listed and trading on the ChiNext Market of the Shenzhen Stock Exchange. The ChiNext Index is comprised of China A-shares ("A-shares"). | Market Price | 118.30 | 30.32 | 4.76 | 7.42 | 8.98 | 07/23/2014 | Net: 0.65% |
| KraneShares CSI China Internet ETF | KWEB | KWEB is a China ETF that tracks the CSI Overseas China Internet Index, which consists of China based companies whose primary business or businesses are focused on internet and internet-related technology. The Index is free float market capitalization weighted and includes securities traded on the Hong Kong Stock Exchange, NASDAQ, or NYSE. | NAV | -24.38 | 0.40 | -15.96 | -0.85 | 1.74 | 07/31/2013 | Gross: 0.69% |
| KraneShares CSI China Internet ETF | KWEB | KWEB is a China ETF that tracks the CSI Overseas China Internet Index, which consists of China based companies whose primary business or businesses are focused on internet and internet-related technology. The Index is free float market capitalization weighted and includes securities traded on the Hong Kong Stock Exchange, NASDAQ, or NYSE. | Market Price | -24.42 | 0.44 | -15.90 | -0.82 | 1.78 | 07/31/2013 | Net: 0.69% |
The table presents past performance which is no guarantee of future results and which may be lower or higher than current performance. Returns reflect temporary contractual fee waivers and/or expense reimbursements. Had the ETF incurred all expenses and fees, investment returns would have been reduced. Investment returns and ETF share values will fluctuate so that investors' shares, when redeemed, may be worth more or less than their original cost. ETF returns assume that dividends and capital gains distributions have been reinvested in the Fund at NAV.
Van Eck Associates Corporation (the "Adviser") has agreed to waive fees and/or pay Fund expenses to the extent necessary to prevent the operating expenses of the Fund (excluding acquired fund fees and expenses, trading expenses, taxes and extraordinary expenses) from exceeding 0.65% of the Fund's average daily net assets per year until at least May 1, 2027. During such time, the expense limitation is expected to continue until the Fund's Board of Trustees acts to discontinue all or a portion of such expense limitation.
The "Net Asset Value" (NAV) of a VanEck Exchange Traded Fund (ETF) is determined at the close of each business day, and represents the dollar value of one share of the fund; it is calculated by taking the total assets of the fund, subtracting total liabilities, and dividing by the total number of shares outstanding. The NAV is not necessarily the same as the ETF 's intraday trading value. VanEck ETF investors should not expect to buy or sell shares at NAV.
This is not an offer to buy or sell, or a recommendation to buy or sell any of the securities/financial instruments mentioned herein. The information presented does not involve the rendering of personalized investment, financial, legal, or tax advice. Certain statements contained herein may constitute projections, forecasts and other forward looking statements, which do not reflect actual results, are valid as of the date of this communication and subject to change without notice. Information provided by third party sources are believed to be reliable and have not been independently verified for accuracy or completeness and cannot be guaranteed. VanEck does not guarantee the accuracy of third party data. The information herein represents the opinion of the author(s), but not necessarily those of VanEck.
ChiNext Index comprises the 100 largest and most liquid A-share stocks listed and trading on the ChiNext Market of the Shenzhen Stock Exchange.
MSCI China Index tracks large and mid-cap stocks across China A shares, H shares, B shares, Red chips, P chips and foreign listings.
MSCI China A Onshore Index tracks large and mid-cap stocks across China securities listed on the Shanghai and Shenzhen exchanges.
FTSE China Incl A 25% Tech Capped Index is a free-float market-capitalization-weighted index designed to track the performance of large and mid-cap Chinese technology companies.
CSI Overseas China Internet Index is a free-float market-capitalization-weighted index designed to track large-cap Chinese companies in internet-related sectors (e.g., Tencent, Alibaba, PDD) listed in Hong Kong or the U.S.
CSI 300 Index is a free-float market-capitalization-weighted stock market index designed to replicate the performance of the top 300 stocks traded on the mainland Chinese equity markets.
Index returns are not Fund returns and do not reflect any management fees or brokerage expenses. Certain indices may take into account withholding taxes. Investors cannot invest directly in the Index. Returns for actual Fund investors may differ from what is shown because of differences in timing, the amount invested and fees and expenses. Index returns assume that dividends have been reinvested.
The Fund is subject to risks which include, among others, risk of the RQFII regime and the Fund’s principal investment strategy, investing in China and A-shares, ChiNext Market, investing through Stock Connect, foreign securities, emerging market issuers, foreign currency, consumer staples sector, health care sector, industrials sector, information technology sector, small- and medium-capitalization companies, cash transactions, equity securities, market, operational, index tracking, authorized participant concentration, no guarantee of active trading market, trading issues, passive management, fund shares trading, premium/discount risk and liquidity of fund shares, non-diversification and concentration risks, all of which may adversely affect the Fund. Foreign and emerging markets investments are subject to risks, which include changes in economic and political conditions, foreign currency fluctuations, changes in foreign regulations, changes in currency exchange rates, unstable governments, and limited trading capacity which may make these investments volatile in price or difficult to trade. Small- and medium-capitalization companies may be subject to elevated risks.
Investing involves substantial risk and high volatility, including possible loss of principal. An investor should consider the investment objective, risks, charges and expenses of the Fund carefully before investing. To obtain a prospectus and summary prospectus, which contains this and other information, call 800.826.2333 or visit vaneck.com. Please read the prospectus and summary prospectus carefully before investing.
VanEck mutual funds and ETFs are distributed by Van Eck Securities Corporation, Distributor, a wholly owned subsidiary of Van Eck Associates Corporation.
666 Third Avenue | New York, NY 10017
Related Funds
DISCLOSURES
Quarter End Returns (%) as of 6/30/2026
| Fund Name/Type | Ticker | Investment Objective | Type | 1 Yr | 3 Yr | 5 Yr | 10 Yr | Since Inception | Inception Date | Expense Ratio |
| VanEck ChiNext Innovators ETF | CNXT | VanEck ChiNext Innovators ETF (CNXT) seeks to replicate as closely as possible, before fees and expenses, the price and yield performance of the ChiNext Index (SZ988107), which tracks the performance of the 100 largest and most liquid stocks listed and trading on the ChiNext Market of the Shenzhen Stock Exchange. The ChiNext Index is comprised of China A-shares ("A-shares"). | NAV | 116.91 | 30.32 | 4.74 | 7.37 | 8.99 | 07/23/2014 | Gross: 1.00% |
| VanEck ChiNext Innovators ETF | CNXT | VanEck ChiNext Innovators ETF (CNXT) seeks to replicate as closely as possible, before fees and expenses, the price and yield performance of the ChiNext Index (SZ988107), which tracks the performance of the 100 largest and most liquid stocks listed and trading on the ChiNext Market of the Shenzhen Stock Exchange. The ChiNext Index is comprised of China A-shares ("A-shares"). | Market Price | 118.30 | 30.32 | 4.76 | 7.42 | 8.98 | 07/23/2014 | Net: 0.65% |
| KraneShares CSI China Internet ETF | KWEB | KWEB is a China ETF that tracks the CSI Overseas China Internet Index, which consists of China based companies whose primary business or businesses are focused on internet and internet-related technology. The Index is free float market capitalization weighted and includes securities traded on the Hong Kong Stock Exchange, NASDAQ, or NYSE. | NAV | -24.38 | 0.40 | -15.96 | -0.85 | 1.74 | 07/31/2013 | Gross: 0.69% |
| KraneShares CSI China Internet ETF | KWEB | KWEB is a China ETF that tracks the CSI Overseas China Internet Index, which consists of China based companies whose primary business or businesses are focused on internet and internet-related technology. The Index is free float market capitalization weighted and includes securities traded on the Hong Kong Stock Exchange, NASDAQ, or NYSE. | Market Price | -24.42 | 0.44 | -15.90 | -0.82 | 1.78 | 07/31/2013 | Net: 0.69% |
The table presents past performance which is no guarantee of future results and which may be lower or higher than current performance. Returns reflect temporary contractual fee waivers and/or expense reimbursements. Had the ETF incurred all expenses and fees, investment returns would have been reduced. Investment returns and ETF share values will fluctuate so that investors' shares, when redeemed, may be worth more or less than their original cost. ETF returns assume that dividends and capital gains distributions have been reinvested in the Fund at NAV.
Van Eck Associates Corporation (the "Adviser") has agreed to waive fees and/or pay Fund expenses to the extent necessary to prevent the operating expenses of the Fund (excluding acquired fund fees and expenses, trading expenses, taxes and extraordinary expenses) from exceeding 0.65% of the Fund's average daily net assets per year until at least May 1, 2027. During such time, the expense limitation is expected to continue until the Fund's Board of Trustees acts to discontinue all or a portion of such expense limitation.
The "Net Asset Value" (NAV) of a VanEck Exchange Traded Fund (ETF) is determined at the close of each business day, and represents the dollar value of one share of the fund; it is calculated by taking the total assets of the fund, subtracting total liabilities, and dividing by the total number of shares outstanding. The NAV is not necessarily the same as the ETF 's intraday trading value. VanEck ETF investors should not expect to buy or sell shares at NAV.
This is not an offer to buy or sell, or a recommendation to buy or sell any of the securities/financial instruments mentioned herein. The information presented does not involve the rendering of personalized investment, financial, legal, or tax advice. Certain statements contained herein may constitute projections, forecasts and other forward looking statements, which do not reflect actual results, are valid as of the date of this communication and subject to change without notice. Information provided by third party sources are believed to be reliable and have not been independently verified for accuracy or completeness and cannot be guaranteed. VanEck does not guarantee the accuracy of third party data. The information herein represents the opinion of the author(s), but not necessarily those of VanEck.
ChiNext Index comprises the 100 largest and most liquid A-share stocks listed and trading on the ChiNext Market of the Shenzhen Stock Exchange.
MSCI China Index tracks large and mid-cap stocks across China A shares, H shares, B shares, Red chips, P chips and foreign listings.
MSCI China A Onshore Index tracks large and mid-cap stocks across China securities listed on the Shanghai and Shenzhen exchanges.
FTSE China Incl A 25% Tech Capped Index is a free-float market-capitalization-weighted index designed to track the performance of large and mid-cap Chinese technology companies.
CSI Overseas China Internet Index is a free-float market-capitalization-weighted index designed to track large-cap Chinese companies in internet-related sectors (e.g., Tencent, Alibaba, PDD) listed in Hong Kong or the U.S.
CSI 300 Index is a free-float market-capitalization-weighted stock market index designed to replicate the performance of the top 300 stocks traded on the mainland Chinese equity markets.
Index returns are not Fund returns and do not reflect any management fees or brokerage expenses. Certain indices may take into account withholding taxes. Investors cannot invest directly in the Index. Returns for actual Fund investors may differ from what is shown because of differences in timing, the amount invested and fees and expenses. Index returns assume that dividends have been reinvested.
The Fund is subject to risks which include, among others, risk of the RQFII regime and the Fund’s principal investment strategy, investing in China and A-shares, ChiNext Market, investing through Stock Connect, foreign securities, emerging market issuers, foreign currency, consumer staples sector, health care sector, industrials sector, information technology sector, small- and medium-capitalization companies, cash transactions, equity securities, market, operational, index tracking, authorized participant concentration, no guarantee of active trading market, trading issues, passive management, fund shares trading, premium/discount risk and liquidity of fund shares, non-diversification and concentration risks, all of which may adversely affect the Fund. Foreign and emerging markets investments are subject to risks, which include changes in economic and political conditions, foreign currency fluctuations, changes in foreign regulations, changes in currency exchange rates, unstable governments, and limited trading capacity which may make these investments volatile in price or difficult to trade. Small- and medium-capitalization companies may be subject to elevated risks.
Investing involves substantial risk and high volatility, including possible loss of principal. An investor should consider the investment objective, risks, charges and expenses of the Fund carefully before investing. To obtain a prospectus and summary prospectus, which contains this and other information, call 800.826.2333 or visit vaneck.com. Please read the prospectus and summary prospectus carefully before investing.
VanEck mutual funds and ETFs are distributed by Van Eck Securities Corporation, Distributor, a wholly owned subsidiary of Van Eck Associates Corporation.
666 Third Avenue | New York, NY 10017