Gold Shines Through Market Chaos
March 06, 2020
Read Time 5 MIN
Gold Shines Through Market Chaos
Coronavirus concern was the dominant driver across global markets in February and the gold market was no exception. Gold fell to its monthly low on February 5 as the S&P 500® trended to new all-time highs on the belief that the impact from coronavirus could be contained. As more infections were reported from South Korea, the outlook became clouded and gold had a strong advance to a seven-year high of $1,689 per ounce on February 24. Gold bullion exchange traded funds saw an unprecedented 25 consecutive days of inflows. However, during the last week of the month, markets came unglued as it became clear that the virus was spreading globally with infections in Italy, Iran and the U.S. The stock market crashed, creating a flight to cash, margin calls, and unusual derivatives trading. Safe haven assets such as gold, gold stocks and the U.S. dollar fell in the chaos. For the month, gold declined $3.47 per ounce (0.2%). The NYSE Arca Gold Miners Index (GDMNTR) dropped 8.13% and the MVIS Global Junior Gold Miners Index (MVGDXJTR) declined 10.41%.
Historically, Quick Rebound for Gold Stocks in Panic
While the sell-off in gold stocks was painful, it is not unusual in the midst of a stock market panic. The last such example was the 2008 financial crisis crash. Following the September 15, 2008 Lehman bankruptcy, gold declined just 10% before trending higher on October 27. Over the same period in 2008 the GDMNTR fell 48%, but by December 16 it had recovered to its pre-Lehman level in a classic V-shaped recovery. Contrast this with the S&P 500 that didn’t reach a bottom until March 6, 2009 after falling 46%. The S&P didn’t recover its post Lehman losses until January 2011. So, while the general stock market was struggling to recover for over two years, the gold stock market quickly rebounded and went on to bull market gains. We believe the markets will look back on the coronavirus “black swan” as a buying opportunity for gold shares, however, whether the worst is yet behind us is anyone’s guess.
Economic Impact of Virus Likely to End Expansion
As the virus spreads and the prospects for a vaccine or treatment are months in the making, it appears the economic impact will be substantial and we would not be surprised to see the longest economic expansion and bull market in history to come to an end in 2020. We look to China where the coronavirus has been in play for several months to see the potential depth of economic weakness. The China Manufacturing Purchasing Managers Index (PMI) fell from 50 in January to 35.7 in February, below the previous low of 38.8 in 2008. Likewise, the Non-Manufacturing (or services) PMI plummeted to a record low of 29.6 in February (below 50 is contractionary). The U.S. ISM Manufacturers PMI Index stands at 50.1 while the Non-Manufacturing PMI is 57.3. Meanwhile, the latest Euro Area IHS Markit Manufacturing PMI is 49.2. Note that the U.S. and Euro Area PMI’s were measured before the recent spread of the virus.
The Fed is Running Out of Bullets
Any action the U.S. Federal Reserve (Fed) takes in response to a virus-weakened economy is likely to lack efficacy. There are two aspects that make a coronavirus economy extremely difficult to stimulate. First, this is a deflationary shock with declines or stoppages in work, travel, leisure and other forms of economic activity. Second, it is likely to create shortages due to the interruption of global supply chains, which would normally be inflationary. No amount of rate cuts or quantitative easing will have much impact until people and businesses are able to resume normal activities. In any case, central banks have little or no room to stimulate with the Fed funds rate already low at 1.0% - 1.25% and comparable rates in much of Europe and Japan are negative. The Fed has typically cut rates by roughly 5% in past recessions.
Overwhelming Levels of Debt Could Drive Gold Higher
If there is to be a recession, then we believe that debt will become the foremost risk, as it has been in nearly every recession. Corporate profit growth has been in decline and Goldman Sachs now projects no earnings growth this year. Yet, corporate debt is at record levels as are the amount of risky leveraged loans. In addition, more debt is likely to be downgraded to junk status in a recession, which could force many funds to sell. Meanwhile, overwhelming levels of sovereign debt may limit government’s ability to borrow and spend in a downturn. Central banks may come under pressure to monetize or print money to keep governments and businesses afloat. These are the financial risks that might drive gold higher in the next recession.
Gold Investors Must Not Lose Sight of Bigger Picture
As markets gyrate, gold investors must not lose sight of the bigger picture. For over a year the primary driver of the gold price has been falling real rates. Through the coronavirus crash, ten-year treasury yields have plummeted to all-time lows. With the markets in disarray, gold has not responded to this fall in real rates. Once the volatility subsides, we expect real rates to again become a primary driver of gold prices.
Gold and gold stocks are in the midst of a secular bull market that started in December 2015 when gold bottomed out at $1,050 per ounce. The two gold price charts highlight the technical similarities between the current bull and the 2001 – 2011 bull. The first chart tracks the price trend of the current bull market. It began with a weakly rising trend for several years, then accelerated to a stronger trend in 2019. Likewise, in the second chart an early trend of weakly rising prices broke into a stronger trend in 2005. In the earlier market (second chart), the ultimate trend followed the financial crisis in 2008. The red circle shows roughly where the current market might be in the larger scheme of things, using the 2001 – 2011 market as an analogy.
Fundamentally, each of these markets had different drivers, with the early 2000’s market driven by fallout from the tech bust and U.S. dollar weakness. The early years of the current market were driven by geopolitical risks and Fed activity. Regardless of specific drivers, both markets rose with increasing risks to the global financial system where gold was bought as a safe store of wealth.
Comparing Bulls: Current Market Similar to Gold’s Last Secular Rally
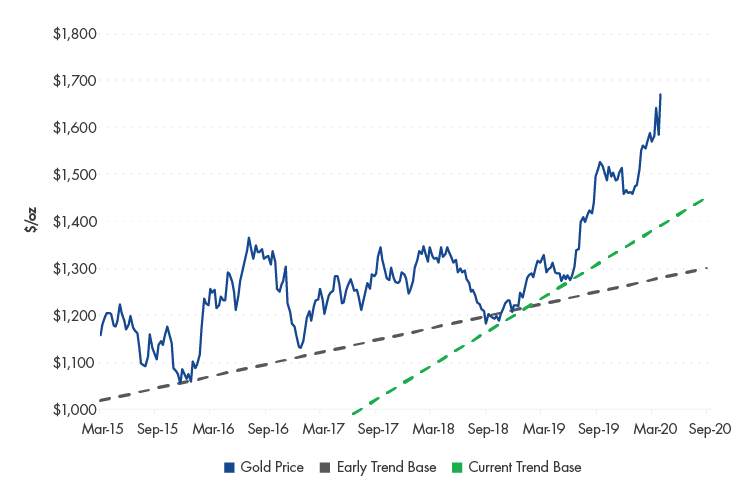
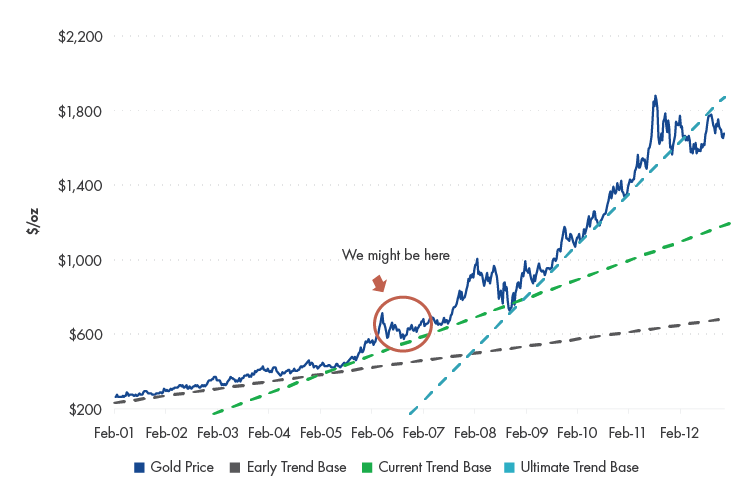
Source: Bloomberg, VanEck. Data as of February 28, 2020. Past performance is no guarantee of future results. Chart is for illustrative purposes only.
Download Commentary PDF with Fund specific information and performance.
DISCLOSURES
All company, sector, and sub-industry weightings as of February 29, 2020 unless otherwise noted. All economic data sourced from Bloomberg and Wall Street Journal.
Nothing in this content should be considered a solicitation to buy or an offer to sell shares of any investment in any jurisdiction where the offer or solicitation would be unlawful under the securities laws of such jurisdiction, nor is it intended as investment, tax, financial, or legal advice. Investors should seek such professional advice for their particular situation and jurisdiction.
The NYSE Arca Gold Miners Index (GDMNTR) is a modified market capitalization-weighted index comprised of publicly traded companies involved primarily in the mining for gold. MVIS Global Junior Gold Miners Index (MVGDXJTR) is a rules-based, modified market capitalization-weighted, float-adjusted index comprised of a global universe of publicly traded small- and medium-capitalization companies that generate at least 50% of their revenues from gold and/or silver mining, hold real property that has the potential to produce at least 50% of the company’s revenue from gold or silver mining when developed, or primarily invest in gold or silver. S&P 500®is a capitalization-weighted index of 500 U.S. stocks from a broad range of industries. The Purchasing Managers’ Index (PMI) are economic indicators derived from monthly surveys of private sector companies. The Institute for Supply Management (ISM) PMI releases an index based on more than 400 purchasing and supply managers surveys both in the manufacturing and non-manufacturing industries.
Any indices listed are unmanaged indices and include the reinvestment of all dividends, but do not reflect the payment of transaction costs, advisory fees or expenses that are associated with an investment in a Fund. Certain indices may take into account withholding taxes. An index’s performance is not illustrative of a Fund’s performance. Indices are not securities in which investments can be made.
NYSE Arca Gold Miners Index is a service mark of ICE Data Indices, LLC or its affiliates (“ICE Data”) and has been licensed for use by VanEck Vectors ETF Trust (the “Trust”) in connection with VanEck Vectors Gold Miners ETF (the “Fund”). Neither the Trust nor the Fund is sponsored, endorsed, sold or promoted by ICE Data. ICE Data makes no representations or warranties regarding the Trust or the Fund or the ability of the NYSE Arca Gold Miners Index to track general stock market performance.
ICE DATA MAKES NO EXPRESS OR IMPLIED WARRANTIES, AND HEREBY EXPRESSLY DISCLAIMS ALL WARRANTIES OF MERCHANTABILITY OR FITNESS FOR A PARTICULAR PURPOSE WITH RESPECT TO THE NYSE ARCA GOLD MINERS INDEX OR ANY DATA INCLUDED THEREIN. IN NO EVENT SHALL ICE DATA HAVE ANY LIABILITY FOR ANY SPECIAL, PUNITIVE, INDIRECT, OR CONSEQUENTIAL DAMAGES (INCLUDING LOST PROFITS), EVEN IF NOTIFIED OF THE POSSIBILITY OF SUCH DAMAGES.
MVIS Global Junior Gold Miners Index (the “Index”) is the exclusive property of MarketVector Indexes GmbH (a wholly owned subsidiary of Van Eck Associates Corporation), which has contracted with Solactive AG to maintain and calculate the Index. Solactive AG uses its best efforts to ensure that the Index is calculated correctly. Irrespective of its obligations towards MarketVector Indexes GmbH, Solactive AG has no obligation to point out errors in the Index to third parties. The VanEck Vectors Junior Gold Miners ETF (the “Fund”) is not sponsored, endorsed, sold or promoted by MarketVector Indexes GmbH and MarketVector Indexes GmbH makes no representation regarding the advisability of investing in the Fund.
The S&P 500® Index is a product of S&P Dow Jones Indices LLC and/or its affiliates and has been licensed for use by Van Eck Associates Corporation. Copyright © 2018 S&P Dow Jones Indices LLC, a division of S&P Global, Inc., and/or its affiliates. All rights reserved. Redistribution or reproduction in whole or in part are prohibited without written permission of S&P Dow Jones Indices LLC. For more information on any of S&P Dow Jones Indices LLC’s indices please visit www.spdji.com. S&P® is a registered trademark of S&P Global and Dow Jones® is a registered trademark of Dow Jones Trademark Holdings LLC. Neither S&P Dow Jones Indices LLC, Dow Jones Trademark Holdings LLC, their affiliates nor their third party licensors make any representation or warranty, express or implied, as to the ability of any index to accurately represent the asset class or market sector that it purports to represent and neither S&P Dow Jones Indices LLC, Dow Jones Trademark Holdings LLC, their affiliates nor their third party licensors shall have any liability for any errors, omissions, or interruptions of any index or the data included therein.
Please note that the information herein represents the opinion of the author, but not necessarily those of VanEck, and this opinion may change at any time and from time to time. Non-VanEck proprietary information contained herein has been obtained from sources believed to be reliable, but not guaranteed. Not intended to be a forecast of future events, a guarantee of future results or investment advice. Historical performance is not indicative of future results. Current data may differ from data quoted. Any graphs shown herein are for illustrative purposes only. No part of this material may be reproduced in any form, or referred to in any other publication, without express written permission of VanEck.
About VanEck International Investors Gold Fund: You can lose money by investing in the Fund. Any investment in the Fund should be part of an overall investment program, not a complete program. The Fund is subject to the risks associated with concentrating its assets in the gold industry, which can be significantly affected by international economic, monetary and political developments. The Fund’s overall portfolio may decline in value due to developments specific to the gold industry. The Fund’s investments in foreign securities involve risks related to adverse political and economic developments unique to a country or a region, currency fluctuations or controls, and the possibility of arbitrary action by foreign governments, or political, economic or social instability. The Fund is subject to risks associated with investments in Canadian issuers, commodities and commodity-linked derivatives, commodities and commodity-linked derivatives tax, gold-mining industry, derivatives, emerging market securities, foreign currency transactions, foreign securities, other investment companies, management, market, non-diversification, operational, regulatory, small- and medium-capitalization companies and subsidiary risks.
Please call 800.826.2333 or visit vaneck.com for performance information current to the most recent month end and for a free prospectus and summary prospectus. An investor should consider a Fund’s investment objective, risks, charges and expenses carefully before investing. The prospectus and summary prospectus contain this as well as other information. Please read them carefully before investing.
©2020 VanEck
Related Funds
DISCLOSURES
All company, sector, and sub-industry weightings as of February 29, 2020 unless otherwise noted. All economic data sourced from Bloomberg and Wall Street Journal.
Nothing in this content should be considered a solicitation to buy or an offer to sell shares of any investment in any jurisdiction where the offer or solicitation would be unlawful under the securities laws of such jurisdiction, nor is it intended as investment, tax, financial, or legal advice. Investors should seek such professional advice for their particular situation and jurisdiction.
The NYSE Arca Gold Miners Index (GDMNTR) is a modified market capitalization-weighted index comprised of publicly traded companies involved primarily in the mining for gold. MVIS Global Junior Gold Miners Index (MVGDXJTR) is a rules-based, modified market capitalization-weighted, float-adjusted index comprised of a global universe of publicly traded small- and medium-capitalization companies that generate at least 50% of their revenues from gold and/or silver mining, hold real property that has the potential to produce at least 50% of the company’s revenue from gold or silver mining when developed, or primarily invest in gold or silver. S&P 500®is a capitalization-weighted index of 500 U.S. stocks from a broad range of industries. The Purchasing Managers’ Index (PMI) are economic indicators derived from monthly surveys of private sector companies. The Institute for Supply Management (ISM) PMI releases an index based on more than 400 purchasing and supply managers surveys both in the manufacturing and non-manufacturing industries.
Any indices listed are unmanaged indices and include the reinvestment of all dividends, but do not reflect the payment of transaction costs, advisory fees or expenses that are associated with an investment in a Fund. Certain indices may take into account withholding taxes. An index’s performance is not illustrative of a Fund’s performance. Indices are not securities in which investments can be made.
NYSE Arca Gold Miners Index is a service mark of ICE Data Indices, LLC or its affiliates (“ICE Data”) and has been licensed for use by VanEck Vectors ETF Trust (the “Trust”) in connection with VanEck Vectors Gold Miners ETF (the “Fund”). Neither the Trust nor the Fund is sponsored, endorsed, sold or promoted by ICE Data. ICE Data makes no representations or warranties regarding the Trust or the Fund or the ability of the NYSE Arca Gold Miners Index to track general stock market performance.
ICE DATA MAKES NO EXPRESS OR IMPLIED WARRANTIES, AND HEREBY EXPRESSLY DISCLAIMS ALL WARRANTIES OF MERCHANTABILITY OR FITNESS FOR A PARTICULAR PURPOSE WITH RESPECT TO THE NYSE ARCA GOLD MINERS INDEX OR ANY DATA INCLUDED THEREIN. IN NO EVENT SHALL ICE DATA HAVE ANY LIABILITY FOR ANY SPECIAL, PUNITIVE, INDIRECT, OR CONSEQUENTIAL DAMAGES (INCLUDING LOST PROFITS), EVEN IF NOTIFIED OF THE POSSIBILITY OF SUCH DAMAGES.
MVIS Global Junior Gold Miners Index (the “Index”) is the exclusive property of MarketVector Indexes GmbH (a wholly owned subsidiary of Van Eck Associates Corporation), which has contracted with Solactive AG to maintain and calculate the Index. Solactive AG uses its best efforts to ensure that the Index is calculated correctly. Irrespective of its obligations towards MarketVector Indexes GmbH, Solactive AG has no obligation to point out errors in the Index to third parties. The VanEck Vectors Junior Gold Miners ETF (the “Fund”) is not sponsored, endorsed, sold or promoted by MarketVector Indexes GmbH and MarketVector Indexes GmbH makes no representation regarding the advisability of investing in the Fund.
The S&P 500® Index is a product of S&P Dow Jones Indices LLC and/or its affiliates and has been licensed for use by Van Eck Associates Corporation. Copyright © 2018 S&P Dow Jones Indices LLC, a division of S&P Global, Inc., and/or its affiliates. All rights reserved. Redistribution or reproduction in whole or in part are prohibited without written permission of S&P Dow Jones Indices LLC. For more information on any of S&P Dow Jones Indices LLC’s indices please visit www.spdji.com. S&P® is a registered trademark of S&P Global and Dow Jones® is a registered trademark of Dow Jones Trademark Holdings LLC. Neither S&P Dow Jones Indices LLC, Dow Jones Trademark Holdings LLC, their affiliates nor their third party licensors make any representation or warranty, express or implied, as to the ability of any index to accurately represent the asset class or market sector that it purports to represent and neither S&P Dow Jones Indices LLC, Dow Jones Trademark Holdings LLC, their affiliates nor their third party licensors shall have any liability for any errors, omissions, or interruptions of any index or the data included therein.
Please note that the information herein represents the opinion of the author, but not necessarily those of VanEck, and this opinion may change at any time and from time to time. Non-VanEck proprietary information contained herein has been obtained from sources believed to be reliable, but not guaranteed. Not intended to be a forecast of future events, a guarantee of future results or investment advice. Historical performance is not indicative of future results. Current data may differ from data quoted. Any graphs shown herein are for illustrative purposes only. No part of this material may be reproduced in any form, or referred to in any other publication, without express written permission of VanEck.
About VanEck International Investors Gold Fund: You can lose money by investing in the Fund. Any investment in the Fund should be part of an overall investment program, not a complete program. The Fund is subject to the risks associated with concentrating its assets in the gold industry, which can be significantly affected by international economic, monetary and political developments. The Fund’s overall portfolio may decline in value due to developments specific to the gold industry. The Fund’s investments in foreign securities involve risks related to adverse political and economic developments unique to a country or a region, currency fluctuations or controls, and the possibility of arbitrary action by foreign governments, or political, economic or social instability. The Fund is subject to risks associated with investments in Canadian issuers, commodities and commodity-linked derivatives, commodities and commodity-linked derivatives tax, gold-mining industry, derivatives, emerging market securities, foreign currency transactions, foreign securities, other investment companies, management, market, non-diversification, operational, regulatory, small- and medium-capitalization companies and subsidiary risks.
Please call 800.826.2333 or visit vaneck.com for performance information current to the most recent month end and for a free prospectus and summary prospectus. An investor should consider a Fund’s investment objective, risks, charges and expenses carefully before investing. The prospectus and summary prospectus contain this as well as other information. Please read them carefully before investing.
©2020 VanEck