CLOs: Dispersion was the 2Q Story, Selection is the Edge
July 22, 2026
Read Time 10+ MIN
Key Takeaways:
- CLOs delivered positive total returns in Q2 2026: spread tightening across the capital stack drove gains in all tranches, with lower-rated mezz leading the way.
- The macro backdrop has shifted hawkish: with the Fed on hold and markets expecting a rate hike, higher-for-longer base rates continue to support all-in yields while amplifying tail risk.
- Dispersion is the defining theme: AI disintermediation and global uncertainty is creating meaningful spread divergence among lower-rated tranches, rewarding rigorous credit selection over broad market exposure.
CLOs posted positive total returns in Q2 2026, as spread tightening across the capital stack drove gains in all tranches. Lower rated tranches were the top performers during the quarter, recovering following their relative weakness during the second half of the first quarter. During the quarter, VanEck CLO ETF (CLOI) (30-day SEC yield as of June 30, 2026: 5.00%) outperformed its benchmark, the J.P. Morgan CLO IG Index, by 13bps (1.66% vs. 1.53%). The VanEck AA-BB CLO ETF (CLOB) (30-day SEC yield as of June 30, 2026: 6.20%) underperformed its benchmark by 0.36% (2.45% vs 2.81%).
With rates on hold and one or two potential hikes by year-end, higher-for-longer base rates continue to support all-in yields at attractive levels and we expect that to sustain demand from both institutional and retail investors through the second half. The tougher question is on the left tail: Iran remains unresolved, energy price pressure has yet to fully filter through to the economy and AI disintermediation may ultimately have more impact returns for certain loan issuers than the current geopolitical unrest. The result is meaningful dispersion among lower-rated tranches and a growing premium on credit selection. Conservative positioning coming into the year has kept us well placed to add selectively across the capital stack, and our bottom-up re-underwriting approach is designed precisely for this kind of environment.
Average Annual Total Returns* (%)
| Quarter End As of 06/30/2026 | 1 MO | 3 MO | YTD | 1 YR | 3 YR | 5 YR | 10 YR | LIFE 06/21/22 |
| CLOI (NAV) | 0.36 | 1.66 | 2.43 | 5.41 | 7.00 | -- | -- | 7.20 |
| CLOI (Market Price) | 0.42 | 1.75 | 2.37 | 5.48 | 6.94 | -- | -- | 7.20 |
| J.P. Morgan CLO IG Index | 0.40 | 1.53 | 2.47 | 5.35 | 7.13 | -- | -- | 7.08 |
*Returns less than one year are not annualized.
The performance data quoted represents past performance. Past performance is not a guarantee of future results. Investment return and principal value of an investment will fluctuate so that an investor's shares, when redeemed, may be worth more or less than their original cost. Performance may be lower or higher than performance data quoted. Please call 800.826.2333 or visit vaneck.com for performance current to the most recent month ended.
CLOI’s gross expense ratio is 0.36% and the total expense ratio is 0.36%. Van Eck Associates Corporation (the “Adviser”) will pay all expenses of the Fund, except for the fee payment under the investment management agreement, acquired fund fees and expenses, interest expense, offering costs, trading expenses, taxes and extraordinary expenses. Notwithstanding the foregoing, the Adviser has agreed to pay the offering costs until at least May 1, 2027. “Other Expenses” have been restated to reflect current fees.
Average Annual Total Returns* (%)
| Quarter End As of 06/30/2026 | 1 MO | 3 MO | YTD | 1 YR | 3 YR | 5 YR | 10 YR | LIFE 09/24/24 |
| CLOB (NAV) | 0.28 | 2.45 | 2.12 | 5.73 | -- | -- | -- | 6.82 |
| CLOB (Market Price) | 0.33 | 2.56 | 2.13 | 5.94 | -- | -- | -- | 6.85 |
| J.P. Morgan CLOIE Balanced Mezzanine Index | 0.28 | 2.81 | 2.48 | 6.12 | -- | -- | -- | 7.11 |
*Returns less than one year are not annualized.
The performance data quoted represents past performance. Past performance is not a guarantee of future results. Investment return and principal value of an investment will fluctuate so that an investor's shares, when redeemed, may be worth more or less than their original cost. Performance may be lower or higher than performance data quoted. Please call 800.826.2333 or visit vaneck.com for performance current to the most recent month ended.
CLOB’s gross expense ratio is 0.45% and the total expense ratio is 0.45%. Van Eck Associates Corporation (the “Adviser”) will pay all expenses of the Fund, except for the fee payment under the investment management agreement, acquired fund fees and expenses, interest expense, offering costs, trading expenses, taxes and extraordinary expenses. Notwithstanding the foregoing, the Adviser has agreed to pay the offering costs until at least May 1, 2027. “Other Expenses” have been restated to reflect current fees.
Market Update
CLO tranches generated positive total returns overall in June. Nonetheless, investors navigated changes to the macroeconomic and geopolitical backdrop during the month, resulting in weakness lower in the stack with BB rated securities generating negative returns. We’ve observed increased dispersion among lower rated tranches, with MVOCs driving tiering among same rated bonds. Additionally, lower Market Value Over-Collateralizations (MVOCs) are depressing CLO equity as weakness in software loans increase the risk of impairment for a growing cohort of CLOs. Credit moves were primarily driven by an interim peace accord between the U.S. and Iran. This breakthrough eased supply chain anxieties by reopening the Strait of Hormuz, resulting in a 15-20% decline in global crude oil prices. While this anticipated energy cost reduction provided market support, the Federal Reserve revealed a hawkish stance in its latest statement with the committee largely split on the appropriate path for future interest rates. Despite this restrictive monetary outlook and potential volatility, loan issuer fundamentals showed improvement during Q1 earnings overall, although CCC-rated issuers continued to be weaker, with revenue and EBITDA contracting. Meanwhile, demand for CLOs remains robust. U.S. CLO ETFs saw inflows of $1.6bn in June, bringing year-to-date inflows to $10bn, and total U.S. CLO ETF AUM over $50bn.
CLO Mezz outperformed other leveraged credit asset classes in Q2, while investment grade CLO tranches outperformed core bonds and U.S. corporates, reinforcing the structural case for the asset class despite a more complicated rate environment.
| Asset class | Q2 2026 Return (%) | YTD 2026 Return (%) | Yield to Worst (%) | Spreads (bps) |
| CLOs | 1.68 | 2.43 | 5.44 | 154 |
| CLOs IG | 1.53 | 2.47 | 5.17 | 127 |
| CLOs Mezz | 2.81 | 2.48 | 7.40 | 343 |
| AAA | 1.36 | 2.39 | 4.92 | 103 |
| AA | 1.59 | 2.60 | 5.18 | 130 |
| A | 1.67 | 2.74 | 5.51 | 161 |
| BBB | 2.86 | 2.70 | 7.18 | 319 |
| BB | 5.12 | 1.80 | 11.78 | 769 |
| B | 11.00 | 0.12 | 17.63 | 1,259 |
| U.S. Agg | 0.71 | 0.77 | 4.75 | 28 |
| Investment Grade Corporates | 1.43 | 1.00 | 5.20 | 76 |
| High Yield Bonds | 2.45 | 1.89 | 7.15 | 275 |
| Leveraged Loans | 1.93 | 1.48 | 8.90 | 515 |
Source: JP Morgan and ICE Data Indices as of 6/30/2026. CLOs represented by J.P. Morgan Collateralized Loan Obligation Index, CLOs IG represented by J.P. Morgan Collateralized Loan Obligation IG Index, CLOs Mezz represented by J.P. Morgan Collateralized Loan Obligation Balanced Mezzanine Index, AAA Rated CLOs represented by J.P. Morgan CLO AAA Index, AA Rated CLOs represented by J.P. Morgan CLO AA Index, A Rated CLOs represented by J.P. Morgan CLO A Index, BBB Rated CLOs represented by J.P. Morgan CLO BBB Index, BB Rated CLOs represented by J.P. Morgan CLO BB Index, B Rated CLOs represented by J.P. Morgan CLO B Index, US Agg is represented by the ICE BofA US Broad Market, Investment Grade Corporates represented by ICE BofA US Corporate Index, High Yield Bonds represented by ICE BofA US High Yield Index and Leveraged Loans represented by JP Morgan Leveraged Loan Index. Past performance is no guarantee of future results. Index performance is not representative of fund performance. It is not possible to invest directly in an index
CLO new issue supply declined month-over-month, totaling $10.2bn in June, compared to $15.4bn in May. Refinancing and reset activity declined month-over-month, but continued at a rapid pace overall, with $36.6bn pricing, after $39.3bn in May. CLO issuance was healthy in the second quarter, with overall new issue volumes of $32.1bn and refinancing and reset activity totaling $95.5bn. However, relative to the first half of last year, new issue and refi/reset volumes are -17% and -4% lower, respectively.
The U.S. leveraged loan market rebounded in the second quarter, generating a total return of 1.87 comprised of 1.78% in interest income and 0.09% in market value appreciation. Risk appetite improved in April and May before softening again in June. Loans rallied sharply early in the period, though performance remained bifurcated as AI disruption concerns pressured Software credits and new issuance stayed well below historical averages. By June, prices traded off amid elevated sector dispersion, evolving Fed expectations, a less supportive technical backdrop, and renewed weakness in Software. Loan market technicals softened in June as net loan supply outpaced demand. Private equity-linked buyout activity rose and offset weaker corporate M&A issuance, contributing to higher net loan supply. New issuance skewed toward higher-quality issuers in June. Repricing activity slowed as loan prices declined, while amend-to-extend activity increased as issuers addressed 2028 maturities. Loan retail funds experienced a net outflow of $227mn in June, compared to a net inflow of $1.3bn in May. CLO formation remained an important source of demand and helped support broader market technicals through much of the quarter, although managers stayed selective in Software given AI-related disruption risk.
Recommended subscription
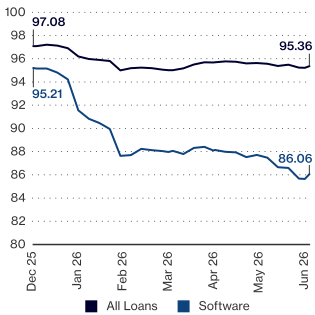
Weighted Average Price of Loan Index vs. Software Loans
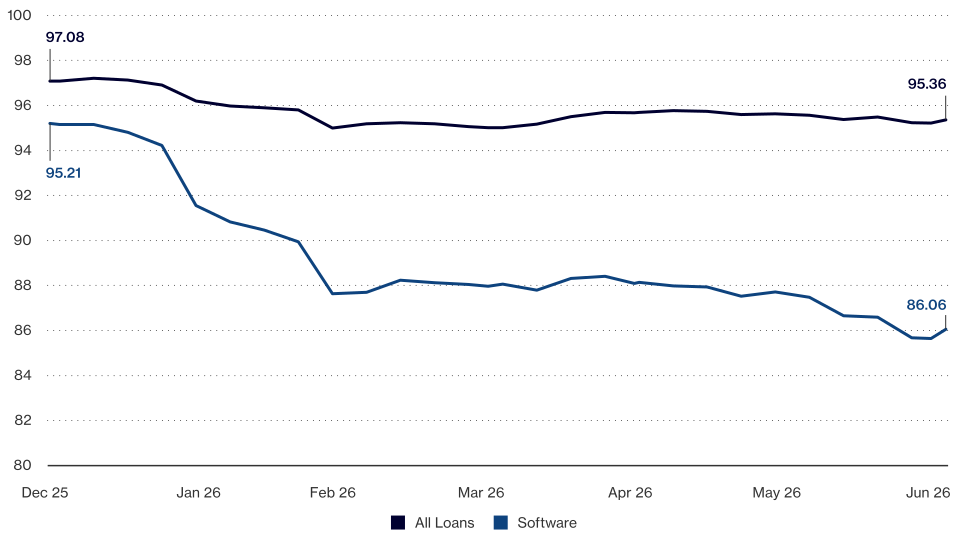
Source: Pitchbook LCD, Morningstar LSTA US Leveraged Loan 100 Index, as of 3 July 2026. Software sector based on GICS Level III classification. For illustrative purposes only.
The trailing twelve-month default rate within the Morningstar U.S. Leveraged Loan Index decreased 38bp to 0.97%. As measured by JP Morgan, the default rate including distressed exchanges, decreased 38bp to 2.29%. Activity has been elevated as borrowers with unsustainable capital structures endeavored to manage their liabilities and avoid the bankruptcy process through liability management exercises, keeping the “official” default rate lower than otherwise. The default rate has declined 94bp over the last four months.
CLO fundamentals mostly deteriorated month-over-month. The weighted average spread (WAS) continues to be under pressure given ongoing loan refinancing activity, declining 2bp in June to 301bp, driving down net spread available to the equity tranche. Year-to-date total returns for CLO equity are estimated at -8% by May month end, as -19% price returns more than offset 11% interest returns. While headline equity arbitrage has improved over the last year (currently at 131bps compared to an average of 107bps in the last year), a bifurcated loan market where higher-quality credits are clustered at tight spreads and trading near par makes bringing a new deal to market challenging. In addition, exposure to loans below 80 and 90 increased 0.3% to 5.2% and 0.8% to 10.8%, respectively, CCC exposure 0.1% to 3.8% and equity NAV declined 4.4% to 33.0%. Meanwhile, on the positive side, weighted average rating factor (WARF) declined 10 points to 2,703 and the minimum OC cushion increased 5bp to 439bp.
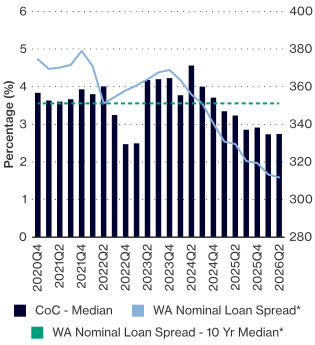
Tighter Nominal Loan Spreads are Reducing CLO Equity Cash-on-Cash Returns
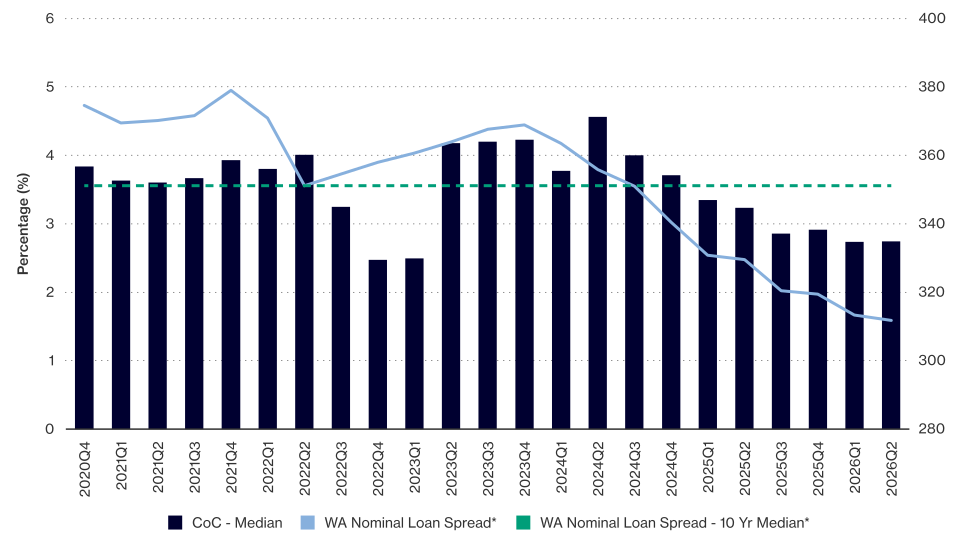
Source: BofA Global Research, Intex, Morningstar LSTA US Leveraged Loan 100 Index, as of 30 June 2026. CoC– Median includes just CLOs within their reinvestment period. *Data excludes defaults. Index performance is not representative of Fund performance. It is not possible to invest directly in an index. Past performance is no guarantee of future results.
U.S. CLO secondary spreads tightened in Q2. The AAA tranche tightened 22bp; AA’s, 24bp; single-A’s, 31bp; BBB’s, 33bp; BB’s, 59bp; and single-B’s, 87bp. Meanwhile, the JP Morgan Leveraged Loan Index widened 22bp and the ICE BofA US HY Index tightened 53bp.
Portfolio Strategy
The borrowing rate for leveraged loan companies remains high following rate increases from central banks in 2022 and 2023. However, borrowing rates moved lower following three rate cuts from the Fed at the end of 2025. The Fed has since shifted to a wait-and-see approach and held rates steady thus far in 2026. Following three hawkish dissents at the April meeting and a hawkish stance following the June meeting, markets now see one to two rate hikes by the end of the year. This is a dramatic shift from year-end where more than two cuts were priced in.
Despite some pockets of widening in June, valuations tightened overall in Q2 and continued to appear expensive overall. Given increasing tail risks in portfolios, we continue to prefer tranche purchases higher in the capital stack. However, selective shorter spread-duration assets for lower rated credits are presenting more attractive entry points amid elevated geopolitical tensions. The ongoing threat of AI disintermediation continues to weigh on the software sector resulting in increased tail risks in portfolios since Q1 and underscores the need for rigorous fundamental credit analysis in CLOs, including stressing recoveries for distressed loans. Despite feeling that IG spreads are tight, we find value in AAA, junior AAA, junior BBB and selective equity tranches. We have also seen increased dispersion between managers lower in the capital stack, which could present attractive opportunities for select purchases of lower rated and equity tranches. We expect there to be additional bouts of volatility in the coming months and would like to maintain the ability to shift further into lower rated tranches during future periods of market weakness. While we found more value in the secondary market following weakness at the end of the first quarter, the primary market is more attractive as the second quarter ends for debt tranches while the secondary market is presenting more attractive entry points for equity tranches.
CLOI Total Return and Credit Allocation
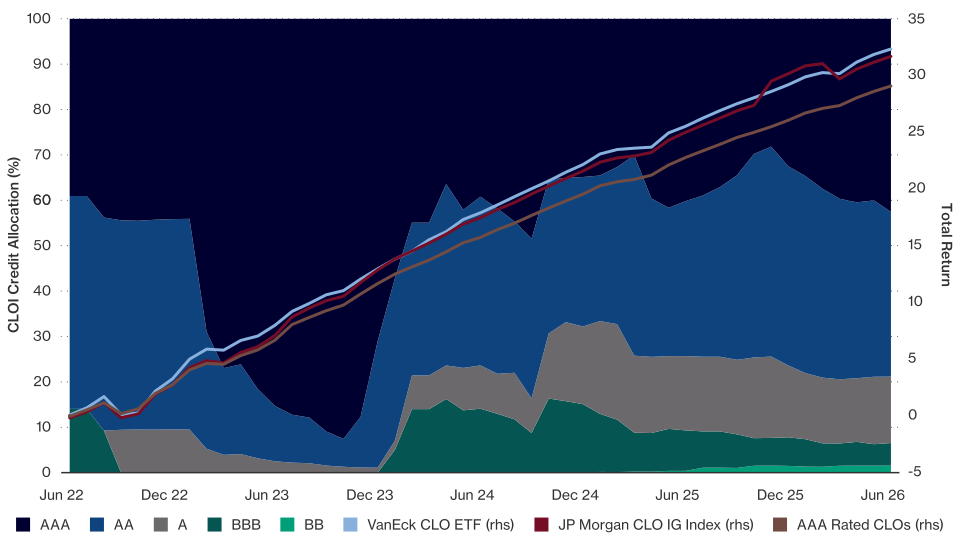
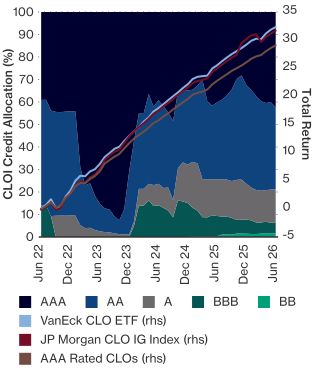
Source: Factset, JP Morgan, VanEck as of June 30, 2026. AAA Rated CLOs represented by J.P. Morgan CLO AAA Index, AA Rated CLOs represented by J.P. Morgan CLO AA Index, A Rated CLOs represented by J.P. Morgan CLO A Index, BBB Rated CLOs represented by J.P. Morgan CLO BBB Index, BB Rated CLOs represented by J.P. Morgan CLO BB Index, Index performance is not representative of Fund performance. It is not possible to invest directly in an index. Past performance is no guarantee of future results. Fund performance current to the most recent month end is available by visiting vaneck.com or by calling 800.826.2333.
CLOB Total Return and Credit Allocation
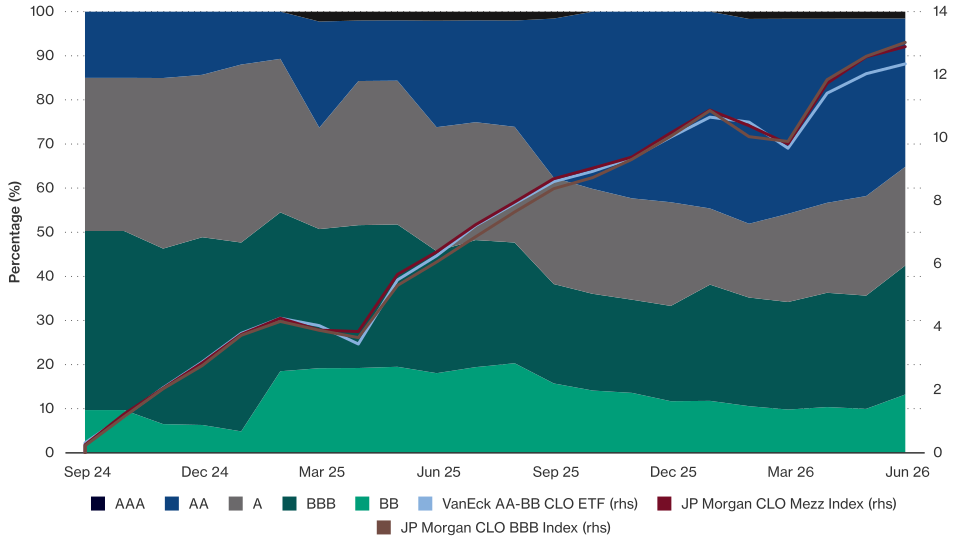
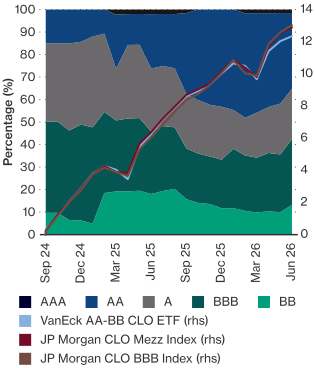
Source: Factset, JP Morgan, VanEck, as of June 30, 2026. AA Rated CLOs represented by J.P. Morgan CLO AA Index, A Rated CLOs represented by J.P. Morgan CLO A Index, BBB Rated CLOs represented by J.P. Morgan CLO BBB Index, BB Rated CLOs represented by J.P. Morgan CLO BB Index, B Rated CLOs represented by J.P. Morgan CLO B Index. Index performance is not representative of Fund performance. It is not possible to invest directly in an index. Past performance is no guarantee of future results. Fund performance current to the most recent month end is available by visiting vaneck.com or by calling 800.826.2333.
Outlook
The May CPI reading showed inflation accelerating to over 4% and was the highest reading since April 2023. In addition, the recent resumption of hostilities and the collapse of the ceasefire agreement between the U.S. and Iran has resulted in spiking energy prices and intensified uncertainty surrounding a possible resolution. Against this backdrop, the market is pricing in a rate hike by the Fed as early as the September meeting with two hikes over the next 12 months. While we believe the market is overstating the likelihood of rate hikes, the rate cuts that were priced in to start the year appear to be off the table. As a result, base rates should remain higher for longer, a boon for floating-rate investors, as all-in yields remain at attractive levels. We expect this to result in ongoing demand from both institutional and retail investors over the second half of the year. In addition, greater clarity on various regulatory regimes – notably, the Basel III Endgame and the NAIC risk-based capital regime – is expected to result in additional demand at the top of the capital stack from banks and insurance companies.
While demand is expected to remain strong, left-tail risk continues to be elevated in CLO portfolios. At a macro level, market valuations appear to be pricing in a near riskless path forward, but the resolution of the conflict in Iran remains elusive. We anticipate that the impact of the energy price spike should start to filter through into the economy in the months ahead. While AI fears have taken a backseat following the continuation of the war in Iran, the outcome is likely to have a bigger impact on long-term performance for loan issuers. As a result of AI disintermediation, we continue to see a repricing of risk premia in the form of wider spreads, higher yields, and lower prices in software and other AI-impacted credits. This has resulted in increased tail risk in portfolios and significant dispersion among lower rated tranches, particularly BB and equity. Low MVOC deals and lower tier managers have seen material weakness relative to healthier portfolios and more established managers, increasing the importance of security selection and understanding the underlying credit risk in CLO portfolios.
As we have observed increasing tail risks in portfolios throughout 2025 and 2026, we continue to prefer tranche purchases higher in the capital stack. However, select shorter spread-duration assets for lower-rated credits are presenting more opportunistic entry points. Given conservative portfolio positioning at the beginning of the year, we have been and continue to be well positioned to opportunistically add both in the primary and secondary markets across the cap stack, but particularly in strategies that can add BBB and lower rated tranches. We believe our bottoms-up approach of re-underwriting portfolios puts us in a good position to take advantage of security selection as spreads widen, focusing on credit selection.
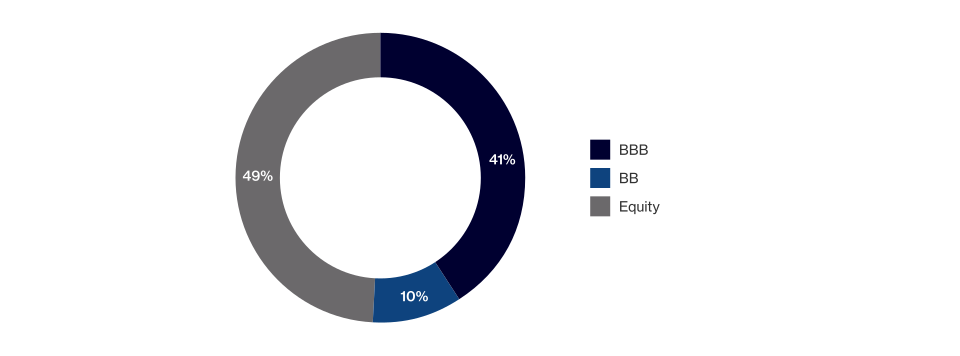
We launched our first interval fund, the VanEck CLO Opportunities Fund, in May. The fund invests primarily in the equity and junior mezzanine debt tranches of collateralized loan obligations (CLOs) backed by broadly syndicated loans. The fund’s structure allows the team to take strategic, long-term positions and may be an attractive alternative to private asset classes, such as private credit. As of June 30, 2026, the Weight Average Portfolio Yield was 11.54%, based on debt yield to worst and equity IRRs.
Fund Characteristics (as of 6/30/2026)
| # Holdings | 19 |
| # Collateral Managers | 13 |
| WAL (Years) | 9.62 |
| Debt | 7.72 |
| Equity | 11.56 |
| Weighted Average Portfolio Yield* (%) | 11.54 |
| Debt YTW | 8.64 |
| Equity IRR | 14.51 |
*Source: VanEck. Not intended as a recommendation to buy or sell any securities mentioned herein. Past performance is not indicative of future results. *Weighted Average Portfolio Yield is a blend of debt yield to worst and equity IRRs, weighted by the market value of each holding as a percentage of the total portfolio.
Average Annual Total Returns* (%)
| Quarter End As of 06/30/2026 | 1 MO | 3 MO | YTD | 1 YR | 3 YR | 5 YR | 10 YR | LIFE (05/01/26) |
| VanEck CLO Opportunities Fund: Class I | ||||||||
| At Net Asset Value | -0.96 | -- | -- | -- | -- | -- | -- | -0.60 |
| J.P. Morgan CLO BB Index | -0.18 | 5.12 | -- | -- | -- | -- | -- | 1.15 |
*Returns less than one year are not annualized.
The tables present past performance which is no guarantee of future results and which may be lower or higher than current performance. Returns reflect temporary contractual fee waivers and/or expense reimbursements. Had the Fund incurred all expenses and fees, investment returns would have been reduced. Expenses: Class I: Gross 2.55% and Net 1.50%. Expenses are capped contractually through 09/01/27 at 0.50% for Class I. Investment returns and Fund share values will fluctuate so that investors' shares, when redeemed, may be worth more or less than their original cost. Fund returns assume that dividends and capital gains distributions have been reinvested in the Fund at NAV.
CLOIX’s gross expense ratio is 2.55%, and its net expense ratio is 1.50%, reflecting contractual fee waivers and expense limitation arrangements in effect through at least September 1, 2027. The arrangements may not be terminated by the Adviser without Board consent. The Adviser may recoup certain waived or reimbursed amounts for up to three years, subject to applicable expense limitations. See the Fund’s prospectus for complete expense and waiver terms.
Rating Breakdown
Source: VanEck.
To receive more Income Investing insights, sign up in our subscription center.

Important Disclosures:
This is not an offer to buy or sell, or a recommendation to buy or sell any of the securities, financial instruments or digital assets mentioned herein. The information presented does not involve the rendering of personalized investment, financial, legal, tax advice, or any call to action. Certain statements contained herein may constitute projections, forecasts and other forward-looking statements, which do not reflect actual results, are for illustrative purposes only, are valid as of the date of this communication, and are subject to change without notice. Actual future performance of any assets or industries mentioned are unknown. Information provided by third party sources are believed to be reliable and have not been independently verified for accuracy or completeness and cannot be guaranteed. VanEck does not guarantee the accuracy of third party data. The information herein represents the opinion of the speaker(s), but not necessarily those of VanEck or its other employees.
30-Day SEC Yield is a standard yield calculation developed by the Securities and Exchange Commission that allows for fairer comparison among funds. It is based on the most recent 30-Day period. This yield figure reflects the interest earned during the period after deducting the Fund’s expenses for the period. It does not reflect the yield an investor would have received if they had held the Fund over the last twelve months assuming the most recent NAV.
Spread duration measures sensitivity to changes in credit spreads. MVOC is the market value of a CLO’s collateral relative to its outstanding obligations. WAS means weighted average spread, and WA means weighted average. Nominal loan spread is the weighted average spread earned on the underlying loan portfolio; the 10-year median is the median nominal loan spread over the preceding 10 years. WARF measures portfolio credit quality, and OC cushion is the amount by which a CLO’s overcollateralization ratio exceeds its required level. WAL means weighted average life, YTW means yield to worst, IRR means internal rate of return, and CoC means cash-on-cash return.
ICE BofA US Corporate Index tracks the performance of US dollar denominated investment grade corporate debt publicly issued in the US domestic market.
ICE BofA US High Yield Index tracks the performance of U.S. dollar-denominated below investment grade corporate debt publicly issued in the U.S. domestic market.
ICE BofA U.S. Broad Market tracks the performance of U.S. dollar denominated investment grade debt publicly issued in the U.S. domestic market, including US Treasury, quasi-government, corporate, securitized and collateralized securities.
J.P. Morgan Collateralized Loan Obligation Index tracks U.S. dollar denominated broadly-syndicated, arbitrage CLOs.
J.P. Morgan CLO IG Index tracks broadly syndicated, arbitrage U.S. CLO debt rated investment grade.
AAA Rated CLOs represented by J.P. Morgan CLO AAA Index is a subset of the J.P. Morgan CLO Index that only tracks the AAA rated CLO.
AA Rated CLOs represented by J.P. Morgan CLO AA Index is a subset of the J.P. Morgan CLO Index that only tracks the AA rated CLO.
A Rated CLOs represented by J.P. Morgan CLO A Index is a subset of the J.P. Morgan CLO Index that only tracks the A rated CLO.
J.P. Morgan Leveraged Loan Index tracks broadly syndicated leveraged loans.
J.P. Morgan Collateralized Loan Obligation Index tracks broadly-syndicated, arbitrage US CLO debt.
J.P. Morgan CLOIE Balanced Mezzanine Index which tracks broadly-syndicated, arbitrage US CLO debt rated AA to BB, comprised of 25% of each rating category.
J.P. Morgan CLO BBB Index is a subset of the CLOIE index that only tracks the BBB rated CLO.
J.P. Morgan CLO BB Index is a subset of the CLOIE index that only tracks the BB rated CLO.
Morningstar LSTA US Leveraged Loan 100 Index seeks to mirror the market-weighted performance of the largest institutional leveraged loans as determined by criteria based upon market weightings, spreads, and interest payments.
CLOI’s benchmark is the J.P. Morgan CLO IG Index, and CLOB’s benchmark is the J.P. Morgan CLOIE Balanced Mezzanine Index. Information has been obtained from sources believed to be reliable but J.P. Morgan does not warrant its completeness or accuracy. The Index is used with permission. The index may not be copied, used or distributed without J.P. Morgan’s written approval. © 2024, J.P. Morgan Chase & Co. All rights reserved. Index performance is not representative of Fund performance. It is not possible to invest directly in an index.
VanEck AA-BB CLO ETF (CLOB) and VanEck CLO ETF (CLOI) Risks
An investment in the VanEck AA-BB CLO ETF (CLOB) and VanEck CLO ETF (CLOI) may be subject to risks which include, but are not limited to, risks related to Collateralized Loan Obligations (CLO), debt securities, foreign currency, foreign securities, investment focus, newly-issued securities, extended settlement, affiliated fund investment, management and capital preservation, derivatives, currency management strategies, cash transactions, market, Sub-Adviser, operational, authorized participant concentration, no guarantee of active trading market, trading issues, fund shares trading, premium/discount, liquidity of fund shares, non-diversified, seed investor, and new fund risks, all of which may adversely affect the Funds. Investments in debt securities may expose the Fund to other risks, such as risks related to liquidity, interest rate, floating rate obligations, credit, call, extension, high yield securities, income, valuation, privately-issued securities, covenant lite loans, default of the underlying asset and CLO manager risks, all of which may impact the Fund’s performance. Derivatives may involve certain costs and risks such as liquidity, interest rate, and the risk that a position could not be closed when most advantageous.
VanEck CLO Opportunities Fund-I (CLOIX) Risks
The fund is subject to a high degree of risk and volatility and could result in significant losses, including the loss of a substantial portion or all of your investment.
An investment in the Fund may be subject to risks, which includes, among others, CLO, CLO equity tranche, debt securities, high yield securities, income, valuation, privately issued securities, covenant lite loans, Secured Overnight Financing Rate (SOFR), investment sourcing, defaulted securities, syndicated loan, correlation, liquidity (quarterly repurchases and underlying investments), leveraging, CLO manager, investment focus, newly issued securities, extended settlement, private credit, underlying fund, business development company, foreign currency, derivatives, repurchase policy, distribution and regulated investment company (RIC) status, new fund, market, active management, non-diversified, potential conflicts of interest, and minimal capitalization risks, all of which may adversely affect the Fund. Debt securities may be subject to additional risks, such as liquidity, interest rate, floating rate obligations, credit, call, and extension risks.
The Fund is a closed-end management investment company structured as an “interval fund,” and its shares are not listed on any securities exchange and are not expected to have a secondary market, so an investment should be considered illiquid. Liquidity is provided only through quarterly repurchase offers conducted pursuant to Rule 23c-3 under the Investment Company Act of 1940, which generally permit the Fund to offer to repurchase between 5% and 25% of outstanding shares per quarter, as determined by the Fund’s Board. Repurchase requests may be oversubscribed and prorated, meaning you may be unable to sell all (or any) of your shares when desired and may have to hold shares for an indefinite period, and repurchase offers may be suspended or postponed in limited circumstances.
The Fund invests primarily in CLO debt and CLO equity (including BBB-rated and lower tranches and unrated equity). CLOs are complex and may be difficult to value and trade and are exposed to leveraged-loan credit risk, including borrower defaults and reduced recoveries. Investments in CLO equity and other junior tranches are subject to structural subordination and “first-loss” risk, including the diversion of cash flows to senior tranches after certain collateral quality test failures, and may result in a partial or total loss of investment.
The Fund may employ leverage, which may magnify gains and losses and increase volatility of the Fund’s net asset value. The Fund’s distributions, if any, are not guaranteed and may be paid from sources other than net investment income, including return of capital or borrowings, which may reduce the Fund’s net asset value and capital available for future investment.
Investing involves substantial risk and high volatility, including possible loss of principal. An investor should consider the investment objective, risks, charges and expenses of the Funds carefully before investing. To obtain a prospectus and summary prospectus, which contain this and other information, call 800.826.2333 or visit vaneck.com. Please read the prospectus and summary prospectus carefully before investing.
© Van Eck Securities Corporation, Distributor, a wholly owned subsidiary of Van Eck Associates Corporation.
Related Funds
Important Disclosures:
This is not an offer to buy or sell, or a recommendation to buy or sell any of the securities, financial instruments or digital assets mentioned herein. The information presented does not involve the rendering of personalized investment, financial, legal, tax advice, or any call to action. Certain statements contained herein may constitute projections, forecasts and other forward-looking statements, which do not reflect actual results, are for illustrative purposes only, are valid as of the date of this communication, and are subject to change without notice. Actual future performance of any assets or industries mentioned are unknown. Information provided by third party sources are believed to be reliable and have not been independently verified for accuracy or completeness and cannot be guaranteed. VanEck does not guarantee the accuracy of third party data. The information herein represents the opinion of the speaker(s), but not necessarily those of VanEck or its other employees.
30-Day SEC Yield is a standard yield calculation developed by the Securities and Exchange Commission that allows for fairer comparison among funds. It is based on the most recent 30-Day period. This yield figure reflects the interest earned during the period after deducting the Fund’s expenses for the period. It does not reflect the yield an investor would have received if they had held the Fund over the last twelve months assuming the most recent NAV.
Spread duration measures sensitivity to changes in credit spreads. MVOC is the market value of a CLO’s collateral relative to its outstanding obligations. WAS means weighted average spread, and WA means weighted average. Nominal loan spread is the weighted average spread earned on the underlying loan portfolio; the 10-year median is the median nominal loan spread over the preceding 10 years. WARF measures portfolio credit quality, and OC cushion is the amount by which a CLO’s overcollateralization ratio exceeds its required level. WAL means weighted average life, YTW means yield to worst, IRR means internal rate of return, and CoC means cash-on-cash return.
ICE BofA US Corporate Index tracks the performance of US dollar denominated investment grade corporate debt publicly issued in the US domestic market.
ICE BofA US High Yield Index tracks the performance of U.S. dollar-denominated below investment grade corporate debt publicly issued in the U.S. domestic market.
ICE BofA U.S. Broad Market tracks the performance of U.S. dollar denominated investment grade debt publicly issued in the U.S. domestic market, including US Treasury, quasi-government, corporate, securitized and collateralized securities.
J.P. Morgan Collateralized Loan Obligation Index tracks U.S. dollar denominated broadly-syndicated, arbitrage CLOs.
J.P. Morgan CLO IG Index tracks broadly syndicated, arbitrage U.S. CLO debt rated investment grade.
AAA Rated CLOs represented by J.P. Morgan CLO AAA Index is a subset of the J.P. Morgan CLO Index that only tracks the AAA rated CLO.
AA Rated CLOs represented by J.P. Morgan CLO AA Index is a subset of the J.P. Morgan CLO Index that only tracks the AA rated CLO.
A Rated CLOs represented by J.P. Morgan CLO A Index is a subset of the J.P. Morgan CLO Index that only tracks the A rated CLO.
J.P. Morgan Leveraged Loan Index tracks broadly syndicated leveraged loans.
J.P. Morgan Collateralized Loan Obligation Index tracks broadly-syndicated, arbitrage US CLO debt.
J.P. Morgan CLOIE Balanced Mezzanine Index which tracks broadly-syndicated, arbitrage US CLO debt rated AA to BB, comprised of 25% of each rating category.
J.P. Morgan CLO BBB Index is a subset of the CLOIE index that only tracks the BBB rated CLO.
J.P. Morgan CLO BB Index is a subset of the CLOIE index that only tracks the BB rated CLO.
Morningstar LSTA US Leveraged Loan 100 Index seeks to mirror the market-weighted performance of the largest institutional leveraged loans as determined by criteria based upon market weightings, spreads, and interest payments.
CLOI’s benchmark is the J.P. Morgan CLO IG Index, and CLOB’s benchmark is the J.P. Morgan CLOIE Balanced Mezzanine Index. Information has been obtained from sources believed to be reliable but J.P. Morgan does not warrant its completeness or accuracy. The Index is used with permission. The index may not be copied, used or distributed without J.P. Morgan’s written approval. © 2024, J.P. Morgan Chase & Co. All rights reserved. Index performance is not representative of Fund performance. It is not possible to invest directly in an index.
VanEck AA-BB CLO ETF (CLOB) and VanEck CLO ETF (CLOI) Risks
An investment in the VanEck AA-BB CLO ETF (CLOB) and VanEck CLO ETF (CLOI) may be subject to risks which include, but are not limited to, risks related to Collateralized Loan Obligations (CLO), debt securities, foreign currency, foreign securities, investment focus, newly-issued securities, extended settlement, affiliated fund investment, management and capital preservation, derivatives, currency management strategies, cash transactions, market, Sub-Adviser, operational, authorized participant concentration, no guarantee of active trading market, trading issues, fund shares trading, premium/discount, liquidity of fund shares, non-diversified, seed investor, and new fund risks, all of which may adversely affect the Funds. Investments in debt securities may expose the Fund to other risks, such as risks related to liquidity, interest rate, floating rate obligations, credit, call, extension, high yield securities, income, valuation, privately-issued securities, covenant lite loans, default of the underlying asset and CLO manager risks, all of which may impact the Fund’s performance. Derivatives may involve certain costs and risks such as liquidity, interest rate, and the risk that a position could not be closed when most advantageous.
VanEck CLO Opportunities Fund-I (CLOIX) Risks
The fund is subject to a high degree of risk and volatility and could result in significant losses, including the loss of a substantial portion or all of your investment.
An investment in the Fund may be subject to risks, which includes, among others, CLO, CLO equity tranche, debt securities, high yield securities, income, valuation, privately issued securities, covenant lite loans, Secured Overnight Financing Rate (SOFR), investment sourcing, defaulted securities, syndicated loan, correlation, liquidity (quarterly repurchases and underlying investments), leveraging, CLO manager, investment focus, newly issued securities, extended settlement, private credit, underlying fund, business development company, foreign currency, derivatives, repurchase policy, distribution and regulated investment company (RIC) status, new fund, market, active management, non-diversified, potential conflicts of interest, and minimal capitalization risks, all of which may adversely affect the Fund. Debt securities may be subject to additional risks, such as liquidity, interest rate, floating rate obligations, credit, call, and extension risks.
The Fund is a closed-end management investment company structured as an “interval fund,” and its shares are not listed on any securities exchange and are not expected to have a secondary market, so an investment should be considered illiquid. Liquidity is provided only through quarterly repurchase offers conducted pursuant to Rule 23c-3 under the Investment Company Act of 1940, which generally permit the Fund to offer to repurchase between 5% and 25% of outstanding shares per quarter, as determined by the Fund’s Board. Repurchase requests may be oversubscribed and prorated, meaning you may be unable to sell all (or any) of your shares when desired and may have to hold shares for an indefinite period, and repurchase offers may be suspended or postponed in limited circumstances.
The Fund invests primarily in CLO debt and CLO equity (including BBB-rated and lower tranches and unrated equity). CLOs are complex and may be difficult to value and trade and are exposed to leveraged-loan credit risk, including borrower defaults and reduced recoveries. Investments in CLO equity and other junior tranches are subject to structural subordination and “first-loss” risk, including the diversion of cash flows to senior tranches after certain collateral quality test failures, and may result in a partial or total loss of investment.
The Fund may employ leverage, which may magnify gains and losses and increase volatility of the Fund’s net asset value. The Fund’s distributions, if any, are not guaranteed and may be paid from sources other than net investment income, including return of capital or borrowings, which may reduce the Fund’s net asset value and capital available for future investment.
Investing involves substantial risk and high volatility, including possible loss of principal. An investor should consider the investment objective, risks, charges and expenses of the Funds carefully before investing. To obtain a prospectus and summary prospectus, which contain this and other information, call 800.826.2333 or visit vaneck.com. Please read the prospectus and summary prospectus carefully before investing.
© Van Eck Securities Corporation, Distributor, a wholly owned subsidiary of Van Eck Associates Corporation.