How Do CLOs Perform in a Downturn?
July 17, 2026
Read Time 10+ MIN
Key Takeaways:
- CLO drawdowns have historically been smaller than high yield and corporate bonds across every major downturn reviewed, with senior tranches showing the most resilience.
- The type of stress matters more than the stress itself, rate-driven and liquidity-driven downturns hit CLOs differently.
- Across all five episodes, 12-month returns following peak drawdowns were strong.
How Do CLOs Perform in a Downturn?
Collateralized Loan Obligations (CLOs) are one of the most misunderstood corners of fixed income, often grouped with broader structured products and written off as too complex during times of stress. A decade of real market data tells a more nuanced story: how CLOs perform in a downturn depends far more on the type of stress than on stress itself.
This blog examines CLO performance across five distinct market downturns: the 2013 Taper Tantrum, the 2015-2016 Oil Collapse, the Q4 2018 growth scare, the Covid liquidity shock, and the 2022 inflation sell-off; comparing results against corporate bonds, high yield, leveraged loans, and the broad corporate market. The evidence reveals a consistent pattern: CLO structures respond differently to macro shocks, and that difference has historically worked in investors' favor.
What Determines How CLOs Perform in a Downturn?
Periods of market stress are often treated as a single category, but history shows that not all downturns are the same. Over the past decade, fixed income markets have experienced a wide range of shocks, from liquidity withdrawals and deflation scares to policy mistakes and inflation-driven sell-offs. Each episode produced very different outcomes across rates, credit, and structured products.
This matters for CLOs as performance is often driven less by macro headlines and more by the type of stress in the markets. Understanding how CLOs behaved during prior downturns provides a clearer framework for evaluating their resilience.
CLO Drawdowns
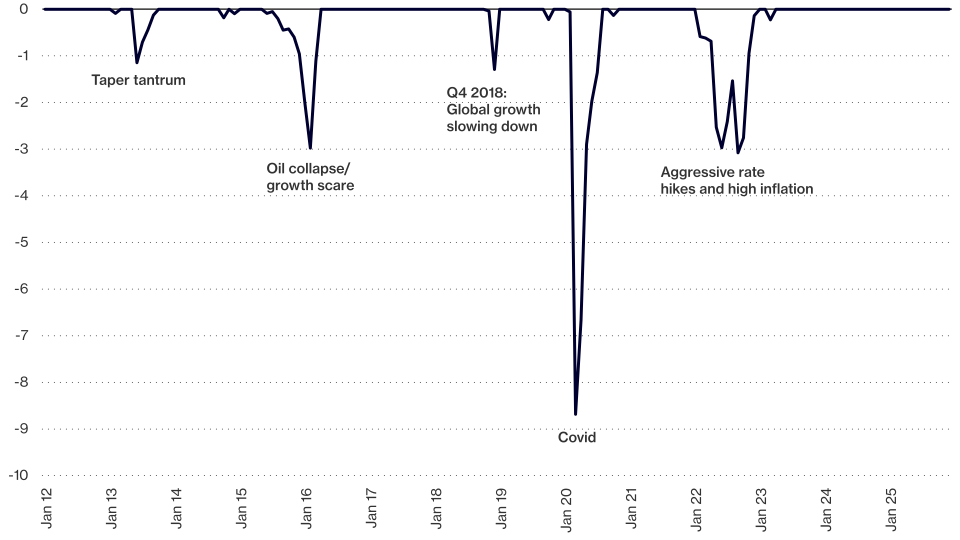
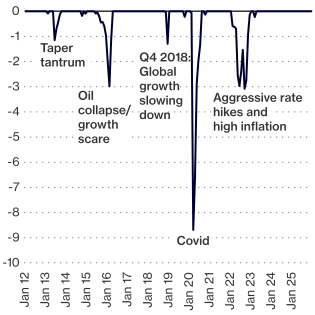
Source: JP Morgan. CLO refers to the JP Morgan CLO Index. Drawdown figures are percentages. Past performance is no guarantee of future results. Index performance is not representative of fund performance. It is not possible to invest directly in an index. See index definitions and important disclosures below.
We reviewed how CLOs performed across these five downturns and compared results to corporate bonds, high yield, leveraged loans, and the broad corporate market.
How Did CLOs Perform During the 2013 Taper Tantrum?
The 2013 taper tantrum was a result of a repricing of interest rate expectations as the Federal Reserve (Fed) announced a reduction in its bond purchases, rather than a deterioration in corporate fundamentals. While traditional fixed income experienced sharp price volatility as yields reset higher (the 10Y U.S. Treasury yield rose from roughly 1.6% in early May to about 2.6% by late June), CLO drawdowns were relatively modest and short-lived, particularly in the senior tranches, due largely to their price insensitivity to movements in long-term bond yields. The data below shows that CLOs recovered quickly, with lower-rated tranches posting double-digit returns 12 months after their peak drawdown.
CLO vs. Traditional Fixed Income: Taper Tantrum Drawdown & Recovery
| Taper Tantrum | Drawdown | Peak Drawdown Date | Drawdown Period | 12m Return After Peak |
| AAA CLO | -0.66 | 6/30/2013 | June 2013 - Oct 2013 | 1.81% |
| AA CLO | -0.95 | 6/30/2013 | June 2013 - Oct 2013 | 2.37% |
| A CLO | -1.89 | 6/30/2013 | June 2013 - Aug 2013 | 4.93% |
| BBB CLO | -2.95 | 6/30/2013 | June 2013 - Sept 2013 | 6.97% |
| BB CLO | -5.58 | 6/30/2013 | June 2013 - Oct 2013 | 10.73% |
| B CLO | -6.39 | 6/30/2013 | June 2013 - Oct 2013 | 10.63% |
| CLOs | -1.15 | 6/30/2013 | June 2013 - Oct 2013 | 2.84% |
| IG CLOs | -0.95 | 6/30/2013 | June 2013 - Sept 2013 | 2.48% |
| AA-BB CLOs | -2.84 | 6/30/2013 | June 2013 - Sept 2013 | 6.22% |
| Corp Bonds | -4.98 | 6/30/2013 | May 2013 - March 2014 | 7.98% |
| High Yield | -3.15 | 6/30/2013 | May 2013 - Sept 2013 | 11.80% |
| Leveraged Loans | -0.59 | 6/30/2013 | June 2013 | 5.59% |
| Agg | -3.87 | 8/31/2013 | May 2013 - April 2014 | 5.82% |
Source: Morningstar Direct, JP Morgan, VanEck. AAA CLO represented by J.P. Morgan CLO AAA Index, AA CLO represented by J.P. Morgan CLO AA Index, A CLO represented by J.P. Morgan CLO A Index, BBB CLO represented by J.P. Morgan CLO BBB Index, BB CLO represented by J.P. Morgan CLO BB Index, B CLO represented by J.P. Morgan CLO B Index, "CLOs" represented by the J.P. Morgan CLO Index, IG CLOs represented by the J.P. Morgan CLO IG Index, AA-BB CLOs represented by the J.P. Morgan CLOIE Balanced Mezzanine Index, Corp Bonds represented by ICE BofA US Corporate Index, High Yield represented by ICE BofA US High Yield Index, Leveraged Loans represented by Morningstar LSTA US Leveraged Loan Index, and Agg represented by the ICE BofA US Broad Market. Past performance is no guarantee of future results. Index performance is not representative of fund performance. It is not possible to invest directly in an index. See index definitions and important disclosures below.
How Did CLOs Hold Up During the 2015-2016 Oil Collapse?
The 2015-2016 downturn was driven by collapsing energy prices (oil fell below $30) and global growth fears, leading to significant dispersion within credit markets, with the 10Y yield falling from roughly 2.3% at the end of 2015 to about 1.6% in early 2016. High yield bonds experienced deep and prolonged drawdowns, particularly within the energy sector. CLOs proved more resilient, supported by diversified collateral pools and limited exposure to concentrated sector risk. Drawdowns were deeper than in 2013 but remained manageable, and the 12-month returns following peak stress were strong across most CLO tranches, emphasizing the need for active management.
CLO vs. Traditional Fixed Income: Oil Collapse Drawdown & Recovery
| Oil Collapse / Growth Scare | Drawdown | Peak Drawdown Date | Drawdown Period | 12m After Peak |
| AAA CLO | -0.64 | 2/29/2016 | Jan 2016 - Feb 2016 | 4.39% |
| AA CLO | -2.46 | 2/29/2016 | July 2015 - March 2016 | 7.76% |
| A CLO | -4.18 | 2/29/2016 | June 2015 - March 2016 | 11.75% |
| BBB CLO | -10.78 | 2/29/2016 | June 2015 - June 2016 | 22.71% |
| BB CLO | -20.66 | 2/29/2016 | June 2015 - June 2016 | 44.78% |
| B CLO | -33.64 | 2/29/2016 | June 2015 - Nov 2016 | 75.29% |
| CLOs | -2.98 | 2/29/2016 | June 2015 - June 2016 | 8.54% |
| IG CLOs | -1.77 | 2/29/2016 | Aug 2015 - June 2016 | 6.58% |
| AA-BB CLOs | -9.75 | 2/29/2016 | June 2015 - June 2016 | 21.11% |
| Corp Bonds | -3.28 | 12/31/2015 | Feb 2015 - Feb 2016 | 5.96% |
| High Yield | -9.83 | 1/31/2016 | June 2015 - May 2016 | 20.98% |
| Leveraged Loans | -4.95 | 2/29/2016 | June 2015 - April 2016 | 12.66% |
| Agg | -2.22 | 6/30/2015 | Feb 2015 - Jan 2016 | 6.12% |
Source: Morningstar Direct, JP Morgan, VanEck. Past performance is no guarantee of future results. Index performance is not representative of fund performance. It is not possible to invest directly in an index. See index definitions and important disclosures below.
Did CLOs Outperform During the Q4 2018 Market Selloff?
The fourth quarter of 2018 marked a sharp tightening in financial conditions as the Fed continued rate hikes and balance sheet reduction due to slowing global growth and the escalation of the U.S. vs. China trade war. CLOs experienced drawdowns alongside broader fixed income markets, but the magnitude was significantly smaller than in high yield bonds. Recovery was swift following the Fed's policy pivot in early 2019. Drawdown periods were relatively short and forward returns were solid, while long-duration assets such as corporate bonds benefited more directly from falling rates.
CLO vs. Traditional Fixed Income: Q4 2018 Drawdown & Recovery
| Q4 2018: Global Growth Slowing Down | Drawdown | Peak Drawdown Date | Drawdown Period | 12m After Peak |
| AAA CLO | -0.63 | 12/31/2018 | Dec 2018 | 4.61% |
| AA CLO | -1.42 | 12/31/2018 | Nov 2018 - Dec 2018 | 5.95% |
| A CLO | -2.77 | 12/31/2018 | Nov 2018 - Feb 2019 | 6.72% |
| BBB CLO | -3.91 | 12/31/2018 | Dec 2018 - Feb 2019 | 8.91% |
| BB CLO | -5.14 | 12/31/2018 | Nov 2018 - Feb 2019 | 10.84% |
| B CLO | -5.70 | 12/31/2018 | Nov 2018 - April 2019 | 4.17% |
| CLOs | -1.29 | 12/31/2018 | Nov 2018 - Dec 2018 | 5.50% |
| IG CLOs | -1.08 | 12/31/2018 | Dec 2018 | 5.23% |
| AA-BB CLOs | -3.30 | 12/31/2018 | Nov 2018 - Feb 2019 | 8.12% |
| Corp Bonds | -3.70 | 11/30/2018 | Jan 2018 - Jan 2019 | 15.58% |
| High Yield | -4.67 | 12/31/2018 | Oct 2018 - Jan 2019 | 14.41% |
| Leveraged Loans | -3.45 | 12/31/2018 | Oct 2018 - Jan 2019 | 8.64% |
| Agg | -2.45 | 10/31/2018 | Sept 2017 - Dec 2018 | 11.72% |
Source: Morningstar Direct, JP Morgan, VanEck. Past performance is no guarantee of future results. Index performance is not representative of fund performance. It is not possible to invest directly in an index. See index definitions and important disclosures below.
How Did CLOs Perform During Covid?
March 2020 was an extreme liquidity event driven by deleveraging, as price discovery deteriorated across fixed income markets. Prices declined sharply during the height of the crisis, reflecting forced selling rather than a reassessment of long-term credit fundamentals. After the Fed supported the market and restored liquidity, recoveries were quick, with 12-month returns following peak drawdowns among the strongest on record.
CLO vs. Traditional Fixed Income: Covid Drawdown & Recovery
| Covid | Drawdown | Peak Drawdown Date | Drawdown Period | 12m After Peak |
| AAA CLO | -5.00 | 3/31/2020 | Mar 2020 - July 2020 | 7.77% |
| AA CLO | -9.32 | 3/31/2020 | Feb 2020 - July 2020 | 13.67% |
| A CLO | -12.66 | 3/31/2020 | Feb 2020 - July 2020 | 19.61% |
| BBB CLO | -21.35 | 3/31/2020 | Feb 2020 - Oct 2020 | 33.67% |
| BB CLO | -34.39 | 3/31/2020 | Feb 2020 - Oct 2020 | 65.28% |
| B CLO | -44.75 | 4/30/2020 | Feb 2020 - Nov 2020 | 111.11% |
| CLOs | -8.68 | 3/31/2020 | Feb 2020 - Aug 2020 | 12.93% |
| IG CLOs | -7.21 | 3/31/2020 | Mar 2020 - July 2020 | 10.85% |
| AA-BB CLOs | -19.49 | 3/31/2020 | Feb 2020 - Oct 2020 | 32.14% |
| Corp Bonds | -7.47 | 3/31/2020 | Mar 2020 - May 2020 | 9.30% |
| High Yield | -13.13 | 3/31/2020 | Feb 2020 - July 2020 | 23.31% |
| Leveraged Loans | -13.53 | 3/31/2020 | Feb 2020 - Oct 2020 | 20.71% |
| Agg | -0.71 | 3/31/2020 | Mar 2020 | 0.55% |
Source: Morningstar Direct, JP Morgan, VanEck. Past performance is no guarantee of future results. Index performance is not representative of fund performance. It is not possible to invest directly in an index. See index definitions and important disclosures below.
Why Did CLOs Outperform in the aggressive rate hikes and higher inflation of 2022?
The 2022 inflation-driven sell-off was different from prior downturns. Persistent inflation and aggressive monetary tightening pressured most fixed income assets at the same time. Unlike duration-sensitive bonds, CLOs benefited from higher base rates, which helped offset spread volatility and limited drawdowns relative to traditional credit. While price pressure lasted longer than in prior episodes, cumulative returns remained competitive and recoveries were steady, showing the advantages of floating-rate exposure in a rising rate environment.
CLO vs. Traditional Fixed Income: 2022 Inflation Drawdown & Recovery
| Inflation Was Not Transitory: CPI Hit 9% | Drawdown | Peak Drawdown Date | Drawdown Period | 12m After Peak |
| AAA CLO | -1.87 | 6/30/2022 | Feb 2022 - Oct 2022 | 6.71% |
| AA CLO | -3.78 | 6/30/2022 | Feb 2022 - Dec 2022 | 8.32% |
| A CLO | -5.96 | 9/30/2022 | Feb 2022 - Jan 2023 | 14.69% |
| BBB CLO | -8.70 | 10/31/2022 | Feb 2022 - April 2023 | 18.15% |
| BB CLO | -10.68 | 9/30/2022 | Feb 2022 - Mar 2023 | 23.48% |
| B CLO | -11.67 | 10/31/2022 | May 2022 - June 2023 | 22.17% |
| CLOs | -3.08 | 9/30/2022 | Feb 2022 - Dec 2022 | 10.91% |
| IG CLOs | -2.69 | 6/30/2022 | Feb 2022 - Nov 2022 | 7.28% |
| AA-BB CLOs | -7.13 | 9/30/2022 | Feb 2022 - Jan 2023 | 16.82% |
| Corp Bonds | -20.11 | 10/31/2022 | Aug 2021 - Sept 2025 | 3.25% |
| High Yield | -14.62 | 9/30/2022 | Jan 2022 - Nov 2023 | 10.19% |
| Leveraged Loans | -4.90 | 6/30/2022 | Feb 2022 - Dec 2022 | 10.70% |
| Agg | -11.96 | 6/30/2022 | Aug 2020 - ongoing | -1.10% |
Source: Morningstar Direct, JP Morgan, VanEck. Past performance is no guarantee of future results. Index performance is not representative of fund performance. It is not possible to invest directly in an index. See index definitions and important disclosures below.
Recommended subscription
Are CLOs Resilient During Market Downturns?
Across five different downturns, the data show that CLO performance has been shaped less by the presence of stress and more by its source. When downturns were driven by rates, policy uncertainty, or liquidity, CLO drawdowns were generally contained and recoveries were relatively swift. Even in more severe environments, such as Covid and the 2022 inflation shock, CLO structures showed an ability to preserve long-term value.
These episodes point to a consistent theme: CLOs behave differently than traditional fixed income because their return drivers: floating-rate collateral, structural subordination, and diversified exposure, respond differently to macro shocks. That difference has, across five distinct episodes, generally been an advantage.
How Can Investors Get Exposure to CLOs?
For investors seeking liquid exposure to the CLO market, the VanEck CLO ETF (CLOI) offers a straightforward way to participate. CLOI invests primarily in investment-grade CLO tranches, targeting the senior end of the capital structure where drawdowns have historically been most contained, as the data above shows across every downturn reviewed. As the last decade shows, understanding how CLOs perform across a range of downturns can help investors better assess where they may fit within a portfolio.
For investors who want more yield potential across the CLO capital structure, the VanEck AA-BB CLO ETF (CLOB) provides access to mezzanine and junior tranches, which have historically delivered some of the strongest 12-month post-drawdown recoveries in the dataset.
For those seeking exposure further down the capital structure, the VanEck CLO Opportunities Fund (CLOIX) invests in CLO equity and junior mezzanine debt, seeking high income through active management. As the last decade shows, understanding how CLOs perform across a range of downturns can help investors better assess where each fund may fit within a portfolio.
To receive more Income Investing insights, sign up in our subscription center.

Important Disclosures
Index Definitions
J.P. Morgan CLO AAA, AA, A, BBB, BB and B Indexes track U.S. dollar-denominated broadly syndicated CLO debt tranches by rating category; the JP Morgan CLO Index tracks the broader CLO market; "CLOs" is represented by the J.P. Morgan CLO Index (broad CLO market); "IG CLOs" is represented by the J.P. Morgan CLO IG Index, a subset of the CLOIE tracking AAA- through BBB-rated CLO debt; "AA-BB CLOs" is represented by the J.P. Morgan CLOIE Balanced Mezzanine Index, which tracks broadly syndicated, arbitrage U.S. CLO debt rated AA to BB, comprised of 25% of each rating category; ICE BofA US Corporate Index tracks U.S. dollar-denominated investment-grade corporate debt; ICE BofA US High Yield Index tracks below-investment-grade U.S. dollar corporate debt; Morningstar LSTA US Leveraged Loan Index tracks the U.S. leveraged loan market; and ICE BofA US Broad Market Index tracks the broad U.S. dollar investment grade bond market. CPI refers to the Consumer Price Index. Indices are unmanaged and are not securities in which investments can be made. All indices listed are unmanaged and include the reinvestment of dividends, but do not reflect transaction costs, fees or expenses that are associated with an investment. An index’s performance is not illustrative of any Fund’s performance. Past performance is no guarantee of future results.
Sources
Source for tables: Morningstar Direct, JP Morgan, VanEck. AAA CLO represented by J.P. Morgan CLO AAA Index, AA CLO represented by J.P. Morgan CLO AA Index, A CLO represented by J.P. Morgan CLO A Index, BBB CLO represented by J.P. Morgan CLO BBB Index, BB CLO represented by J.P. Morgan CLO BB Index, B CLO represented by J.P. Morgan CLO B Index, "CLOs" represented by the J.P. Morgan CLO Index, IG CLOs represented by the J.P. Morgan CLO IG Index, AA-BB CLOs represented by the J.P. Morgan CLOIE Balanced Mezzanine Index, Corp Bonds represented by ICE BofA US Corporate Index, High Yield represented by ICE BofA US High Yield Index, Leveraged Loans represented by Morningstar LSTA US Leveraged Loan Index, and Agg represented by the ICE BofA US Broad Market.
Risk Considerations
This is not an offer to buy or sell, or a recommendation to buy or sell any of the securities, financial instruments or digital assets mentioned herein. The information presented does not involve the rendering of personalized investment, financial, legal, tax advice, or any call to action. Certain statements contained herein may constitute projections, forecasts and other forward–looking statements, which do not reflect actual results, are for illustrative purposes only, are valid as of the date of this communication, and are subject to change without notice. Actual future performance of any assets or industries mentioned are unknown. Information provided by third party sources are believed to be reliable and have not been independently verified for accuracy or completeness and cannot be guaranteed. VanEck does not guarantee the accuracy of third party data. The information herein represents the opinion of the author(s), but not necessarily those of VanEck or its other employees.
VanEck CLO Opportunities Fund (“CLOIX”) Risks
The fund is subject to a high degree of risk and volatility and could result in significant losses, including the loss of a substantial portion or all of your investment.
An investment in the Fund may be subject to risks which includes, among others, CLO, CLO equity tranche, debt securities, high yield securities, income, valuation, privately issued securities, covenant lite loans, Secured Overnight Financing Rate (SOFR), investment sourcing, defaulted securities, syndicated loan, correlation, liquidity (quarterly repurchases and underlying investments), leveraging, CLO manager, investment focus, newly issued securities, extended settlement, private credit, underlying fund, business development company, foreign currency, derivatives, repurchase policy, distribution and regulated investment company (RIC) status, new fund, market, active management, non–diversified, potential conflicts of interest, and minimal capitalization risks, all of which may adversely affect the Fund. Debt securities may be subject to additional risks, such as liquidity, interest rate, floating rate obligations, credit, call, and extension risks.
The Fund is a closed–end management investment company structured as an “interval fund,” and its shares are not listed on any securities exchange and are not expected to have a secondary market, so an investment should be considered illiquid. Liquidity is provided only through quarterly repurchase offers conducted pursuant to Rule 23c–3 under the Investment Company Act of 1940, which generally permit the Fund to offer to repurchase between 5% and 25% of outstanding shares per quarter, as determined by the Fund’s Board. Repurchase requests may be oversubscribed and prorated, meaning you may be unable to sell all (or any) of your shares when desired and may have to hold shares for an indefinite period, and repurchase offers may be suspended or postponed in limited circumstances.
The Fund invests primarily in CLO debt and CLO equity (including BBB–rated and lower tranches and unrated equity). CLOs are complex and may be difficult to value and trade and are exposed to leveraged–loan credit risk, including borrower defaults and reduced recoveries. Investments in CLO equity and other junior tranches are subject to structural subordination and “first–loss” risk, including the diversion of cash flows to senior tranches after certain collateral quality test failures, and may result in a partial or total loss of investment.
The Fund may employ leverage, which may magnify gains and losses and increase volatility of the Fund’s net asset value. The Fund’s distributions, if any, are not guaranteed and may be paid from sources other than net investment income, including return of capital or borrowings, which may reduce the Fund’s net asset value and capital available for future investment.
VanEck AA–BB CLO ETF (CLOB) and VanEck CLO ETF (CLOI) Risks
An investment in the VanEck AA-BB CLO ETF (CLOB) and VanEck CLO ETF (CLOI) may be subject to risks which include, but are not limited to, risks related to Collateralized Loan Obligations (CLO), debt securities, CLO manager, foreign currency, foreign securities, investment focus, newly-issued securities, extended settlement, affiliated fund investment, management and capital preservation, derivatives, currency management strategies, cash transactions, market, operational, authorized participant concentration, no guarantee of active trading market, trading issues, fund shares trading, premium/discount, liquidity of fund shares and non-diversified risks, all of which may adversely affect the Funds. Investments in debt securities may expose the Funds to other risks, such as risks related to liquidity, interest rate, floating rate obligations, credit, call, extension, high yield securities, income, valuation, privately-issued securities, covenant lite loans, and default of the underlying asset risks, all of which may impact the Funds’ performance. Derivatives may involve certain costs and risks such as liquidity, interest rate, and the risk that a position could not be closed when most advantageous.
Investing involves substantial risk and high volatility, including possible loss of principal. An investor should consider the investment objective, risks, charges and expenses of the Funds carefully before investing. To obtain a prospectus and summary prospectus, which contain this and other information, call 800.826.2333 or visit vaneck.com. Please read the prospectus and summary prospectus carefully before investing.
© Van Eck Securities Corporation, Distributor, a wholly–owned subsidiary of Van Eck Associates Corporation.
Related Funds
Important Disclosures
Index Definitions
J.P. Morgan CLO AAA, AA, A, BBB, BB and B Indexes track U.S. dollar-denominated broadly syndicated CLO debt tranches by rating category; the JP Morgan CLO Index tracks the broader CLO market; "CLOs" is represented by the J.P. Morgan CLO Index (broad CLO market); "IG CLOs" is represented by the J.P. Morgan CLO IG Index, a subset of the CLOIE tracking AAA- through BBB-rated CLO debt; "AA-BB CLOs" is represented by the J.P. Morgan CLOIE Balanced Mezzanine Index, which tracks broadly syndicated, arbitrage U.S. CLO debt rated AA to BB, comprised of 25% of each rating category; ICE BofA US Corporate Index tracks U.S. dollar-denominated investment-grade corporate debt; ICE BofA US High Yield Index tracks below-investment-grade U.S. dollar corporate debt; Morningstar LSTA US Leveraged Loan Index tracks the U.S. leveraged loan market; and ICE BofA US Broad Market Index tracks the broad U.S. dollar investment grade bond market. CPI refers to the Consumer Price Index. Indices are unmanaged and are not securities in which investments can be made. All indices listed are unmanaged and include the reinvestment of dividends, but do not reflect transaction costs, fees or expenses that are associated with an investment. An index’s performance is not illustrative of any Fund’s performance. Past performance is no guarantee of future results.
Sources
Source for tables: Morningstar Direct, JP Morgan, VanEck. AAA CLO represented by J.P. Morgan CLO AAA Index, AA CLO represented by J.P. Morgan CLO AA Index, A CLO represented by J.P. Morgan CLO A Index, BBB CLO represented by J.P. Morgan CLO BBB Index, BB CLO represented by J.P. Morgan CLO BB Index, B CLO represented by J.P. Morgan CLO B Index, "CLOs" represented by the J.P. Morgan CLO Index, IG CLOs represented by the J.P. Morgan CLO IG Index, AA-BB CLOs represented by the J.P. Morgan CLOIE Balanced Mezzanine Index, Corp Bonds represented by ICE BofA US Corporate Index, High Yield represented by ICE BofA US High Yield Index, Leveraged Loans represented by Morningstar LSTA US Leveraged Loan Index, and Agg represented by the ICE BofA US Broad Market.
Risk Considerations
This is not an offer to buy or sell, or a recommendation to buy or sell any of the securities, financial instruments or digital assets mentioned herein. The information presented does not involve the rendering of personalized investment, financial, legal, tax advice, or any call to action. Certain statements contained herein may constitute projections, forecasts and other forward–looking statements, which do not reflect actual results, are for illustrative purposes only, are valid as of the date of this communication, and are subject to change without notice. Actual future performance of any assets or industries mentioned are unknown. Information provided by third party sources are believed to be reliable and have not been independently verified for accuracy or completeness and cannot be guaranteed. VanEck does not guarantee the accuracy of third party data. The information herein represents the opinion of the author(s), but not necessarily those of VanEck or its other employees.
VanEck CLO Opportunities Fund (“CLOIX”) Risks
The fund is subject to a high degree of risk and volatility and could result in significant losses, including the loss of a substantial portion or all of your investment.
An investment in the Fund may be subject to risks which includes, among others, CLO, CLO equity tranche, debt securities, high yield securities, income, valuation, privately issued securities, covenant lite loans, Secured Overnight Financing Rate (SOFR), investment sourcing, defaulted securities, syndicated loan, correlation, liquidity (quarterly repurchases and underlying investments), leveraging, CLO manager, investment focus, newly issued securities, extended settlement, private credit, underlying fund, business development company, foreign currency, derivatives, repurchase policy, distribution and regulated investment company (RIC) status, new fund, market, active management, non–diversified, potential conflicts of interest, and minimal capitalization risks, all of which may adversely affect the Fund. Debt securities may be subject to additional risks, such as liquidity, interest rate, floating rate obligations, credit, call, and extension risks.
The Fund is a closed–end management investment company structured as an “interval fund,” and its shares are not listed on any securities exchange and are not expected to have a secondary market, so an investment should be considered illiquid. Liquidity is provided only through quarterly repurchase offers conducted pursuant to Rule 23c–3 under the Investment Company Act of 1940, which generally permit the Fund to offer to repurchase between 5% and 25% of outstanding shares per quarter, as determined by the Fund’s Board. Repurchase requests may be oversubscribed and prorated, meaning you may be unable to sell all (or any) of your shares when desired and may have to hold shares for an indefinite period, and repurchase offers may be suspended or postponed in limited circumstances.
The Fund invests primarily in CLO debt and CLO equity (including BBB–rated and lower tranches and unrated equity). CLOs are complex and may be difficult to value and trade and are exposed to leveraged–loan credit risk, including borrower defaults and reduced recoveries. Investments in CLO equity and other junior tranches are subject to structural subordination and “first–loss” risk, including the diversion of cash flows to senior tranches after certain collateral quality test failures, and may result in a partial or total loss of investment.
The Fund may employ leverage, which may magnify gains and losses and increase volatility of the Fund’s net asset value. The Fund’s distributions, if any, are not guaranteed and may be paid from sources other than net investment income, including return of capital or borrowings, which may reduce the Fund’s net asset value and capital available for future investment.
VanEck AA–BB CLO ETF (CLOB) and VanEck CLO ETF (CLOI) Risks
An investment in the VanEck AA-BB CLO ETF (CLOB) and VanEck CLO ETF (CLOI) may be subject to risks which include, but are not limited to, risks related to Collateralized Loan Obligations (CLO), debt securities, CLO manager, foreign currency, foreign securities, investment focus, newly-issued securities, extended settlement, affiliated fund investment, management and capital preservation, derivatives, currency management strategies, cash transactions, market, operational, authorized participant concentration, no guarantee of active trading market, trading issues, fund shares trading, premium/discount, liquidity of fund shares and non-diversified risks, all of which may adversely affect the Funds. Investments in debt securities may expose the Funds to other risks, such as risks related to liquidity, interest rate, floating rate obligations, credit, call, extension, high yield securities, income, valuation, privately-issued securities, covenant lite loans, and default of the underlying asset risks, all of which may impact the Funds’ performance. Derivatives may involve certain costs and risks such as liquidity, interest rate, and the risk that a position could not be closed when most advantageous.
Investing involves substantial risk and high volatility, including possible loss of principal. An investor should consider the investment objective, risks, charges and expenses of the Funds carefully before investing. To obtain a prospectus and summary prospectus, which contain this and other information, call 800.826.2333 or visit vaneck.com. Please read the prospectus and summary prospectus carefully before investing.
© Van Eck Securities Corporation, Distributor, a wholly–owned subsidiary of Van Eck Associates Corporation.