The Coming Wave of IG Supply Is a Case for Selectivity
October 19, 2026
Read Time 7 MIN
Key Takeaways
- The AI infrastructure buildout is driving a significant wave of IG (Investment Grade) bond issuance, with technology supply up roughly 61% year-over-year and AI- and data-center-related deals topping $300 billion in 2026.
- The index behind the VanEck Moody’s Analytics IG Corporate Bond ETF (MIG) targets bonds where compensation exceeds risk, leaning into names the market misprices and passing on those it does not.
- Meta and Adobe illustrate this in practice: same investment grade market completely different outcomes in the model.
- The case of Paramount illustrates the potential value of avoiding a credit with declining fundamentals and a forced sell-off when the bonds crossed into high yield.
Investment-grade fixed income investors face a difficult balance: spreads near multi-decade tights, issuance at record highs, and concentration risk building inside passive funds. In this environment, how an index decides what to own matters more than it has in years.
The Supply Wave: How AI Infrastructure Is Driving Record IG Bond Issuance
The AI infrastructure buildout is transforming the investment-grade bond market from the supply side. Building data centers, chips, and power behind AI requires capital on a scale that outstrips even the most profitable technology companies' cash generation.
Goldman Sachs estimates the hyperscalers could spend roughly $5.3 trillion on AI and data centers by 2030, and McKinsey puts the broader global data-center buildout near $7 trillion. As the Bank for International Settlements observed in January 2026, the technology sector, long able to fund itself from operating cash flow, is now turning to the debt markets to finance this investment. That shift is reshaping corporate balance sheets and is also raising questions about credit quality.
The result is a meaningful increase in supply in the investment grade. For the entire U.S. IG market, J.P. Morgan projects:
- A record ~$1.81 trillion of gross U.S. IG issuance in 2026
- Net supply near $800 billion, the highest since 2020
- Technology issuance up roughly 61% to about $250 billion
- AI- and data-center-related deals topping $300 billion in a single year
Not surprisingly, higher spreads have come with the increase in supply. As shown in the table below, hyperscalers exhibit spreads which are significantly higher than the average of their rating category. This may signify attractive value, driven by technicals, or potentially higher risk as leverage increases. We generally believe that the massive wave of hyperscaler issuance has created attractive entry points in these names.
Hyperscaler Stats
| Composite Rating* | Issuer Wtd Avg Spread (bps) | Avg Spread for Rating | Difference | |
| ORCL | BBB2 | 208 | 96 | 113 |
| META | AA3 | 126 | 62 | 64 |
| AMZN | AA3 | 76 | 62 | 14 |
| GOOGL | AA2 | 75 | 54 | 21 |
| MSFT | AAA | 57 | 40 | 17 |
Source: ICE Data Indices as of 9/25/2026. *Represent composite credit ratings These are not recommendations to buy or to sell any security. Securities and holdings may vary.
The Risk
The surge in supply is happening while spreads sit near multi-decade tights, with the broad investment grade market's option-adjusted spread around 81 basis points, leaving limited cushion for a misstep. And if a credit is eventually downgraded out of investment grade, benchmark-tracking funds are forced to sell into a high-yield buyer base that demands wider spreads, a cost that holders simply absorb. As the BIS put it, "leverage does not disappear by being out of sight." In fixed income, avoiding the underperformers can be as important, if not more important, than owning the outperformers.
Recommended subscription
How the Index Behind MIG Approaches Value
VanEck Moody's Analytics IG Corporate Bond ETF (MIG) tracks the MarketVector Moody's Analytics US Investment Grade Corporate Bond Index, a rules-based index that draws on Moody's Analytics' forward-looking credit risk model to determine whether a given bond is priced attractively relative to its credit risk.
The Moody’s Analytics model incorporates live equity-market signals, specifically the relationship between a company's price, asset value, and outstanding liabilities, to assess the probability that a company will default over the life of its debt. Because the model updates daily as stock prices move, it can flag a deteriorating credit well before a rating agency acts.
But the index is not simply a screen for the lowest-risk names. It is designed to hold bonds whose market spreads are most attractive relative to what their fundamentals would justify, the credits where the compensation exceeds the risk. The model is asking whether the bond is cheap or expensive relative to what its actual credit risk warrants, not just whether the company is safe in absolute terms.
Two features follow from that logic. First, the index selects its constituents based on the model's view of value rather than by how much debt an issuer has outstanding. Second, the index uses probability-of-downgrade metrics to screen out bonds with a high likelihood of falling to high yield within 12 months, avoiding the price declines that typically precede a downgrade. The result is a portfolio that, as of 9/30/2026, carries lower credit risk at a comparable yield level.
Meta vs. Adobe: How the Same IG Market Can Produce Opposite Outcomes
When the Model Leans In: Why MIG Holds Meta
Meta shows how the model approaches a name where the market is pricing in meaningful risk from a growing AI debt load. Four major hyperscaler debt issuances have hit the IG market in 2026: Oracle ($25B), Alphabet ($51.85B), Meta itself ($25B), and Amazon ($92.3B), nearly $200 billion in six months. Each issuance event pushed spreads wider as the market absorbed new supply.
Through all of that supply pressure, Meta's stock remained in a healthy range and its balance sheet maintained low leverage even with the additional debt. As of September 2026, Meta's average bond spread had risen to 120 basis points, well above the 79bps where it started the year. The Moody’s Analytics model currently views the spread compensation as more than adequate for the expected risk of default, which remains low. MIG holds Meta. In fact, the index has increased its overall hyperscaler exposure over the past year as spreads have widened but corporate fundamentals remain strong.
Hyperscaler Exposure in MIG
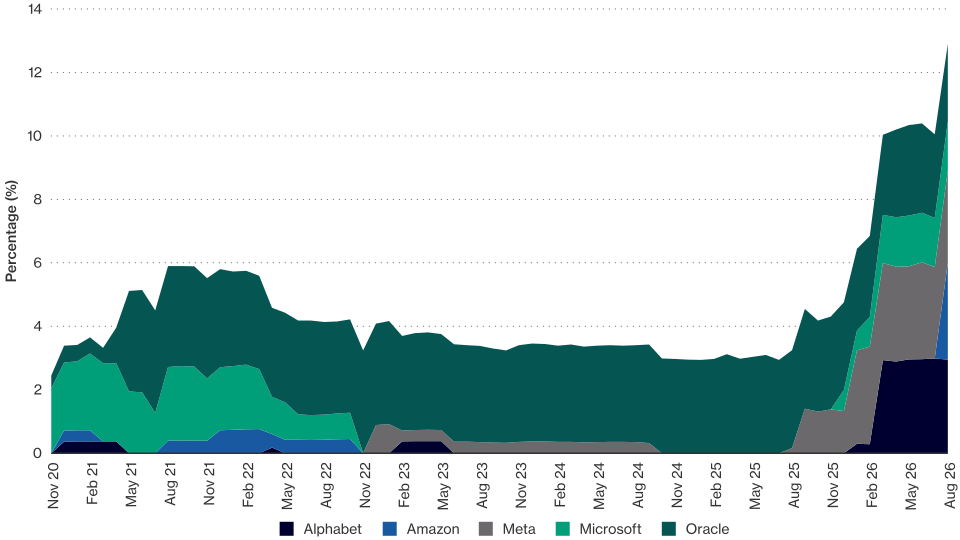
Source: FactSet as of as of 8/31/2026. These are not recommendations to buy or to sell any security. Securities and holdings may vary.
When the Model Steps Away: Software
Software names illustrate the same logic working in the other direction. AI is creating a structural headwind for enterprise software: as AI tools reduce the need for human-led work, businesses may need fewer software licenses, putting pressure on the subscription revenue models that companies like Adobe depend on. Equity markets have priced this in, with many software stocks falling significantly from their early-2025 levels.
The bond market has not moved in the same way. Adobe's 2035 bond was trading at a spread of roughly 76 basis points at the end of September 2026, below the broad IG market average of 84. The apparent gap between what equity investors are pricing and what bond investors are charging is significant.
This is the disconnect the Moody’s Analytics model is designed to catch. Because the model uses a company's stock price as a proxy for the market value of its assets, a software issuer whose stock has fallen significantly may show a narrower cushion between asset value and liabilities, which raises the “fair” spread investors should demand as compensation for this risk. When the bond's actual market spread sits below that level, investors may not be sufficiently compensated for the risk. The index passes on those bonds, and Adobe was not in MIG as of 9/30/2026. The Moody’s model had not deemed Adobe bonds attractive since MIG was launched in December 2020.
Meta and Adobe are both investment grade rated, but with a very different estimate of forward-looking credit risk. The model drew opposite conclusions on which bonds were attractively valued from the same environment.
Avoiding Potential Fallen Angels: Paramount
In March 2024, S&P assigned Paramount its first high yield rating. The company’s bonds retained investment grade status from other agencies and stayed inside IG indices. Then in March 2026, Paramount received a second high yield rating, officially crossing out of investment grade. At that point, investors restricted to investment grade, including ETFs and a number of institutional holdings, were forced to sell.
Paramount’s spread spiked to nearly 484 basis points almost as forced sellers offloaded bonds into a high yield buyer base demanding much greater compensation.
Average Price of Paramount Bonds Prior to Downgrade
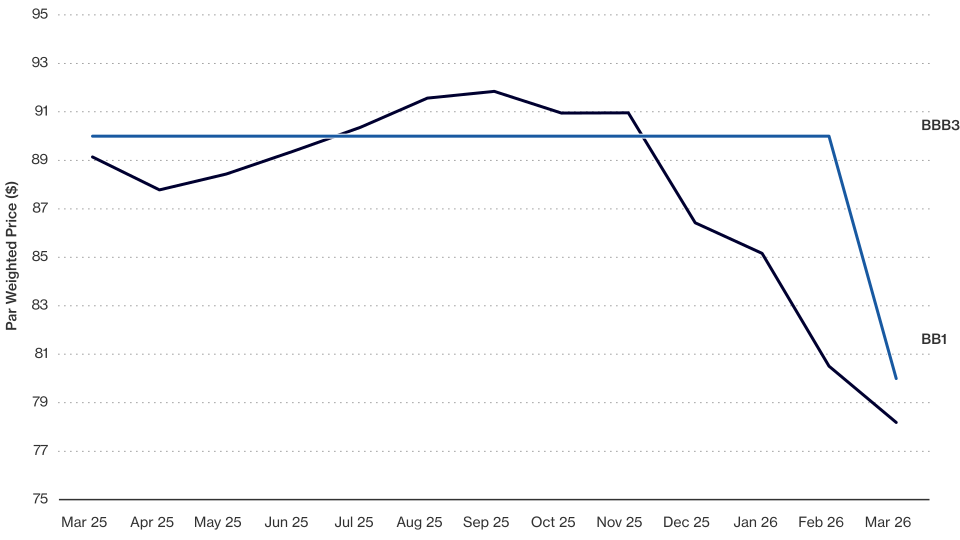
Source: ICE Data Indices as of 3/31/2026. BBB3 and BB1 represent composite credit ratings.
MIG avoided Paramount. Its index is designed to avoid potential fallen angels and bonds that don’t offer sufficient compensation for weak or deteriorating balance sheets which increase the probability of default. The Moody’s Analytics model had identified the deteriorating cushion between the company's assets and liabilities well before the markets adjusted and rating agencies acted.
Why Investment-Grade Selectivity Matters More Now
The case for selectivity within investment grade is not new, but the current environment makes it more relevant.
MIG | VanEck Moody’s Analytics IG Corporate Bond ETF
As AI-driven issuance accelerates, the range of outcomes across IG issuers may widen. Some companies may use debt productively and their bonds may offer spread that more than compensates for the risk. Others may lever up in ways the market and rating agencies are slow to reflect, and their bonds may look cheap on a rating basis while being expensive relative to their actual credit risk. A rules-based process built to distinguish between those two cases could, in such an environment, offer a framework for evaluating those differences.
To receive more Income Investing insights, sign up in our subscription center.

Important Disclosure
Holdings will vary for the MIG ETF and its corresponding Index and are subject to change. For a complete list of holdings in the ETF, please click here.
This is not an offer to buy or sell, or a recommendation to buy or sell any of the securities, financial instruments or digital assets mentioned herein. The information presented does not involve the rendering of personalized investment, financial, legal, tax advice, or any call to action. Certain statements contained herein may constitute projections, forecasts and other forward-looking statements, which do not reflect actual results, are for illustrative purposes only, are valid as of the date of this communication, and are subject to change without notice. Actual future performance of any assets or industries mentioned are unknown. Information provided by third party sources are believed to be reliable and have not been independently verified for accuracy or completeness and cannot be guaranteed. VanEck does not guarantee the accuracy of third party data. The information herein represents the opinion of the author(s), but not necessarily those of VanEck or its other employees.
Examples of issuers and securities discussed herein, including Meta, Adobe, Oracle, Alphabet, Amazon, Microsoft and Paramount, are for illustrative purposes only, were selected to illustrate the Index methodology, are not representative of all Index constituents or Fund holdings, and are not a recommendation to buy or sell any security. There is no guarantee that the Index or the Fund will avoid downgrades or achieve similar results.
The MarketVector Moody’s Analytics US Investment Grade Corporate Bond Index is a rules-based index of U.S. investment grade corporate bonds that draws on Moody’s Analytics’ forward-looking credit risk model to assess whether a bond is priced attractively relative to its credit risk.
An investment in the Fund may be subject to risks which include, among others, investing in European issuers, foreign securities, foreign currency, credit, interest rate, restricted securities, financials sector, information technology sector, consumer staples sector, consumer discretionary sector, market, operational, call, sampling, index tracking, authorized participant concentration, no guarantee of active trading market, trading issues, passive management, data, fund shares trading, premium/discount and liquidity of fund shares, and index-related concentration risks, all of which may adversely affect the Fund. The Fund's assets may be concentrated in a particular sector and may be subject to more risk than investments in a diverse group of sectors.
Investing involves substantial risk and high volatility, including possible loss of principal. Bonds and bond funds will decrease in value as interest rates rise. An investor should consider the investment objective, risks, charges and expenses of the Fund carefully before investing. To obtain a prospectus and summary prospectus, which contains this and other information, call 800.826.2333 or visit vaneck.com. Please read the prospectus and summary prospectus carefully before investing.
© Van Eck Securities Corporation, Distributor, a wholly owned subsidiary of Van Eck Associates Corporation.
Related Funds
Important Disclosure
Holdings will vary for the MIG ETF and its corresponding Index and are subject to change. For a complete list of holdings in the ETF, please click here.
This is not an offer to buy or sell, or a recommendation to buy or sell any of the securities, financial instruments or digital assets mentioned herein. The information presented does not involve the rendering of personalized investment, financial, legal, tax advice, or any call to action. Certain statements contained herein may constitute projections, forecasts and other forward-looking statements, which do not reflect actual results, are for illustrative purposes only, are valid as of the date of this communication, and are subject to change without notice. Actual future performance of any assets or industries mentioned are unknown. Information provided by third party sources are believed to be reliable and have not been independently verified for accuracy or completeness and cannot be guaranteed. VanEck does not guarantee the accuracy of third party data. The information herein represents the opinion of the author(s), but not necessarily those of VanEck or its other employees.
Examples of issuers and securities discussed herein, including Meta, Adobe, Oracle, Alphabet, Amazon, Microsoft and Paramount, are for illustrative purposes only, were selected to illustrate the Index methodology, are not representative of all Index constituents or Fund holdings, and are not a recommendation to buy or sell any security. There is no guarantee that the Index or the Fund will avoid downgrades or achieve similar results.
The MarketVector Moody’s Analytics US Investment Grade Corporate Bond Index is a rules-based index of U.S. investment grade corporate bonds that draws on Moody’s Analytics’ forward-looking credit risk model to assess whether a bond is priced attractively relative to its credit risk.
An investment in the Fund may be subject to risks which include, among others, investing in European issuers, foreign securities, foreign currency, credit, interest rate, restricted securities, financials sector, information technology sector, consumer staples sector, consumer discretionary sector, market, operational, call, sampling, index tracking, authorized participant concentration, no guarantee of active trading market, trading issues, passive management, data, fund shares trading, premium/discount and liquidity of fund shares, and index-related concentration risks, all of which may adversely affect the Fund. The Fund's assets may be concentrated in a particular sector and may be subject to more risk than investments in a diverse group of sectors.
Investing involves substantial risk and high volatility, including possible loss of principal. Bonds and bond funds will decrease in value as interest rates rise. An investor should consider the investment objective, risks, charges and expenses of the Fund carefully before investing. To obtain a prospectus and summary prospectus, which contains this and other information, call 800.826.2333 or visit vaneck.com. Please read the prospectus and summary prospectus carefully before investing.
© Van Eck Securities Corporation, Distributor, a wholly owned subsidiary of Van Eck Associates Corporation.