Broadening Market Lifts Moat Stocks in June
July 09, 2026
Read Time 7 min
Key Takeaways:
- The S&P 500 declined 0.95% as market leadership rotated away from mega-cap tech.
- The Moat Index gained 0.29% as its equal-weighted construction benefitted from the broadening rally.
- Applied Materials and Entegris led Moat Index gains on AI-driven semiconductor equipment demand.
- The SMID Moat Index rose 1.94%, with Marvell and a Bio-Techne acquisition announcement driving gains.
Index performance is not illustrative of fund performance. It is not possible to invest directly in an index. Past performance is no guarantee of future results.
Fair value estimates and price targets referenced herein are those of Morningstar's equity research team, are subject to change without notice, and do not constitute recommendations or investment advice.
U.S. equities turned choppy in June as market leadership rotated away from the mega-cap technology names that had carried the market to record highs. The S&P 500 declined 0.95%, weighed down by its largest constituents, even as the average stock gained and the S&P 500 Equal Weight Index rose 2.38%, a wide gap that signaled broadening participation. An early-month selloff in semiconductor and AI-related shares set the tone, and the Nasdaq Composite fell 2.75%. Sentiment shifted again at the June 17 Federal Reserve meeting, the first led by new Chair Kevin Warsh, where policymakers held rates steady but raised their inflation projections and signaled little urgency to cut. Industrials and health care led the market, while communication services and energy lagged.
The Morningstar Wide Moat Focus Index (the “Moat Index”) gained 0.29% in June, outperforming the S&P 500 as the market broadened and the mega-cap technology names that the equal-weighted Index holds at far lower concentrations than the benchmark pulled back. After trailing the S&P 500 through a stretch of narrow, technology-led gains in recent months, the Index benefited as leadership rotated toward a wider set of stocks. Sector allocation was the primary driver of the relative gain, while stock selection was a partial offset. For the second quarter, the Index gained 7.65%, trailing the S&P 500’s 15.20% advance in a period whose gains remained concentrated in the largest technology stocks.
The Morningstar US Small-Mid Cap Moat Focus Index (the “SMID Moat Index”) rose 1.94% in June, trailing the S&P MidCap 400’s 3.59% gain and the S&P SmallCap 600’s 7.29% advance in a month when smaller-cap stocks broadly led the market’s rotation. The Index drew its strongest contributions from health care and technology holdings, with additional support from building products and other cyclical names. Its quality focus can lag when lower-quality, higher-beta stocks lead the small-cap market, as they did in June, though its holdings still delivered solid absolute gains. For Q2, the SMID Moat Index gained 10.64%.
Broadening Market Lifts Moat Stocks in June
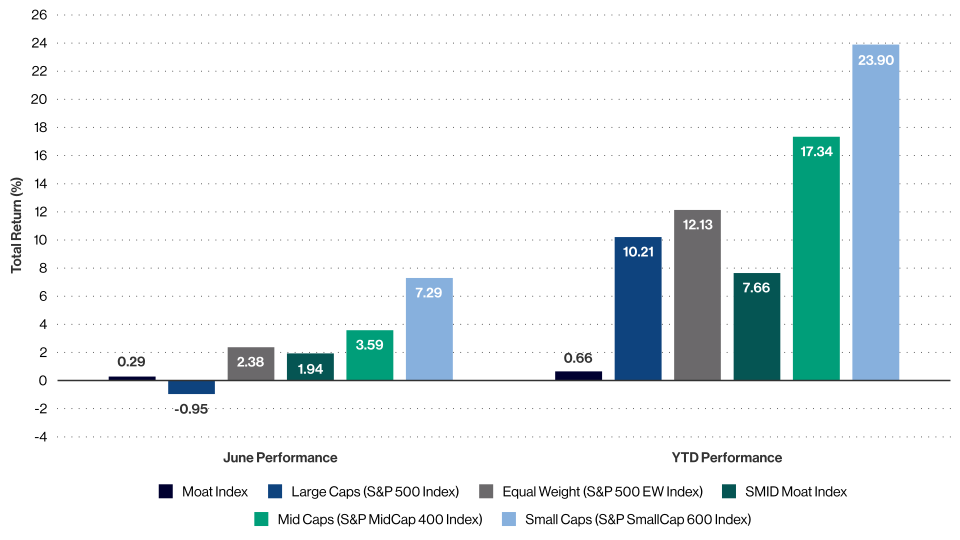
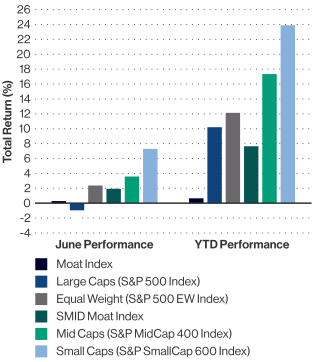
Source: Morningstar. Data as of 6/30/2026. Past performance is no guarantee of future results. Index performance is not representative of fund performance. It is not possible to invest directly in an index. Please see index definitions and other important disclosures at the end of this content. Fund performance current to the most recent month end is available by visiting vaneck.com or by calling 800.826.2333.
Moat Indexes Complete Their Second-Quarter Reviews
Both the Moat and SMID Moat Indexes underwent their quarterly reviews in June, refreshing each portfolio toward the most attractively priced, high-quality companies in their respective universes. Our recent blog, AI Reevaluations Shape Moat Index Turnover, covers key takeaways, and full results are available here for the Moat Index and SMID Moat Index.
Moat Index Highlights: Semis and Cybersecurity Lead a Broadening Market
June was a stronger month for the Moat Index on a relative basis, as the market broadened beyond the mega-cap technology names that had led in recent months. The Index’s equal-weighted construction, which holds those mega-caps at far lower concentrations than the benchmark, provided a tailwind as leadership rotated. Sector allocation was the primary driver of the relative gain, while strong stock selection within technology, led by semiconductor equipment and cybersecurity holdings, was partly offset by weaker selection in other areas of the portfolio.
Semiconductor-related holdings led the Index’s contributors, as investors continued to reward the companies supplying the equipment and materials behind the artificial intelligence buildout, even as some larger chipmakers pulled back. Applied Materials Inc. (AMAT), the largest supplier of wafer-fabrication equipment, advanced roughly 60% after reporting strong quarterly results and raising its growth outlook, with management pointing to accelerating demand tied to leading-edge logic, memory and advanced packaging for AI. Morningstar assigns Applied Materials a wide moat, supported by intangible assets from its industry-leading research budget and by the high switching costs embedded in its equipment and on-site service relationships. Entegris Inc. (ENTG), which supplies purification solutions and specialty materials used throughout chip fabrication, gained approximately 30% on the same AI-driven demand. Morningstar also assigns Entegris a wide moat, reflecting switching costs from its razor-and-blade consumables model and intangible assets in its proprietary purity formulations.
Cybersecurity holdings also contributed meaningfully, extending a theme that has lifted the Index in recent months, as investors increasingly treat security spending as a beneficiary, rather than a casualty, of rising AI adoption. Fortinet Inc. (FTNT) gained roughly 11% after reporting strong quarterly results and raising its full-year sales outlook, with management noting that every new AI deployment widens the corporate attack surface and increases demand for protection. Morningstar views Fortinet’s wide moat as supported by customer switching costs and a network effect that strengthens as more threat data flows across its platform. Palo Alto Networks Inc. (PANW) advanced more than 20%, helped by strong results and broad-based demand across its network, cloud and security-operations platforms. Morningstar assigns Palo Alto a wide moat, underpinned by high switching costs and a reinforcing network effect.
Companies detracting the most from Moat Index performance were also concentrated in technology, though in different corners of the sector than the month’s leaders. Where the Index’s gains came from semiconductor-equipment, materials, and cybersecurity holdings, its detractors were mega-cap platform and chip names that had led the AI trade and gave back ground as leadership rotated. Oracle Corp. (ORCL), a database and cloud-infrastructure provider, was the largest detractor as its shares gave back a portion of their recent AI-driven gains. NXP Semiconductors N.V. (NXPI), a maker of automotive and industrial chips; Microsoft Corp. (MSFT), a software and cloud-computing giant; and Broadcom Inc. (AVGO), a semiconductor and infrastructure-software company, also weighed on results, alongside The Estée Lauder Companies Inc. (EL), a prestige beauty company.
Moat Index Top Contributors and Detractors - June 2026
Contributors
| Company | Ticker | Sector | Avg. Weight (%) | Contribution (%) |
| Applied Materials Inc. | AMAT | Technology | 1.67 | 1.01 |
| Fortinet Inc. | FTNT | Technology | 4.13 | 0.47 |
| Palo Alto Networks Inc. | PANW | Technology | 2.14 | 0.45 |
| Entegris Inc. | ENTG | Technology | 1.48 | 0.44 |
| Masco Corp. | MAS | Industrials | 2.77 | 0.44 |
Detractors
| Company | Ticker | Sector | Avg. Weight (%) | Contribution (%) |
| Oracle Corp | ORCL | Technology | 1.29 | -0.45 |
| NXP Semiconductors | NXPI | Technology | 3.69 | -0.45 |
| Microsoft Corp. | MSFT | Technology | 2.53 | -0.43 |
| The Estee Lauder Companies Inc. | EL | Consumer Staples | 2.29 | -0.26 |
| Broadcom Inc. | AVGO | Technology | 1.62 | -0.25 |
Source: Morningstar. Past performance is no guarantee of future results. Index performance is not illustrative of fund performance. Not intended as a recommendation to buy or to sell any of the securities mentioned herein.
Recommended subscription
SMID Moat Index Highlights: AI Chips and an Acquisition Drive Gains
The SMID Moat Index posted a solid gain in June, with its strongest contributions coming from health care and technology holdings. A blend of AI-linked semiconductor names and company-specific catalysts, including an acquisition announcement among its health care holdings, supported performance across several sectors.
Marvell Technology Inc. (MRVL) was the top contributor, advancing roughly 45% after the company raised its long-term growth outlook and pointed to accelerating demand for its custom AI silicon and optical-connectivity chips. A repeat contributor in recent months, Marvell has been among the clearest small- and mid-cap beneficiaries of data center and AI infrastructure spending. Morningstar assigns Marvell a narrow moat, supported by intangible assets in networking-chip design and customer switching costs.
Bio-Techne Corp. (TECH), a life-sciences supplier of proteins, reagents and instruments used in biopharmaceutical and academic research, advanced roughly 37% after Merck KGaA agreed to acquire the company, sending its shares sharply higher on the announcement. Morningstar assigns Bio-Techne a narrow moat, supported by intangible assets and switching costs in its protein-sciences business, where proprietary consumables account for the bulk of revenue and its reputation for quality underpins durable pricing power.
Other notable contributors included Acuity Inc. (AYI), a lighting and building-management products company; Humana Inc. (HUM), a health insurer; and Masco Corp. (MAS), a maker of home-improvement and building products.
Companies detracting the most from the SMID Moat Index were split between technology names caught in the month’s rotation and commodity-linked cyclicals. Akamai Technologies Inc. (AKAM), a content-delivery, security and cloud-computing provider, was the largest detractor, giving back a portion of its recent gains as enthusiasm around its pivot toward AI compute cooled. Albemarle Corp. (ALB), a specialty-chemicals and lithium producer, and ON Semiconductor Corp. (ON), a maker of power and automotive chips, also weighed on results, alongside Zoom Communications Inc. (ZM), a communications-software provider, and SLB Ltd. (SLB), an oilfield-services company. The mix reflected soft commodity prices and a rotation away from some of the AI-linked technology names that had led in prior months.
SMID Moat Index Top Contributors and Detractors - June 2026
Contributors
| Company | Ticker | Sector | Avg. Weight (%) | Contribution (%) |
| Marvell Technology Inc. | MRVL | Technology | 2.73 | 1.24 |
| Bio-Techne Corp. | TECH | Health Care | 1.11 | 0.41 |
| Acuity Inc. | AYI | Industrials | 1.21 | 0.28 |
| Humana Inc. | HUM | Health Care | 0.76 | 0.23 |
| Masco Corp. | MAS | Industrials | 1.38 | 0.22 |
Detractors
| Company | Ticker | Sector | Avg. Weight (%) | Contribution (%) |
| Akamai Technologies Inc. | AKAM | Technology | 1.99 | -0.42 |
| Albemarle Corp. | ALB | Materials | 1.48 | -0.35 |
| ON Semiconductor Corp. | ON | Technology | 1.25 | -0.27 |
| Zoom Communications Inc. | ZM | Technology | 1.54 | -0.23 |
| SLB Ltd. | SLB | Energy | 1.61 | -0.23 |
Source: Morningstar. Past performance is no guarantee of future results. Index performance is not illustrative of fund performance. Not intended as a recommendation to buy or to sell any of the securities mentioned herein.
Choose Your Moat Strategy
VanEck’s suite of moat investing strategies is powered by Morningstar’s equity research team, which seeks quality companies trading at attractive valuations. The below ETFs offer access to US moat companies:
VanEck Morningstar Wide Moat ETF (MOAT): companies with a wide moat rating, which means Morningstar believes the company is likely to sustain its competitive advantage for at least the next 20 years.
VanEck Morningstar SMID Moat ETF (SMOT): small and mid-cap moat companies.
VanEck Morningstar Wide Moat Value ETF (MVAL): wide moat companies within Morningstar’s value style category.
To receive more Moat Investing insights, sign up in our subscription center.

Important Disclosures
Source for all data unless otherwise noted: Morningstar.
Fair value estimate: the Morningstar analyst's estimate of what a stock is worth. Price/Fair Value: ratio of a stock's trading price to its fair value estimate.
This is not an offer to buy or sell, or a recommendation to buy or sell any of the securities, financial instruments or digital assets mentioned herein. The information presented does not involve the rendering of personalized investment, financial, legal, tax advice, or any call to action. Certain statements contained herein may constitute projections, forecasts and other forward-looking statements, which do not reflect actual results, are for illustrative purposes only, are valid as of the date of this communication, and are subject to change without notice. Actual future performance of any assets or industries mentioned are unknown. Information provided by third party sources are believed to be reliable and have not been independently verified for accuracy or completeness and cannot be guaranteed. VanEck does not guarantee the accuracy of third party data. The information herein represents the opinion of the author(s), but not necessarily those of VanEck or its other employees.
Holdings will vary for the MOAT ETF and its corresponding Index. For a complete list of holdings in the ETF, please click here: https://www.vaneck.com/us/en/investments/morningstar-wide-moat-etf-moat/holdings/.
Holdings will vary for the SMOT ETF and its corresponding Index. For a complete list of holdings in the ETF, please click here: https://www.vaneck.com/us/en/investments/morningstar-smid-moat-etf-smot/holdings/.
Holdings will vary for the MVAL ETF and its corresponding Index. For a complete list of holdings in the ETF, please click here: https://www.vaneck.com/us/en/morningstar-wide-moat-value-etf-mval/holdings/.
An investor cannot invest directly in an index. Returns reflect past performance and do not guarantee future results. Results reflect the reinvestment of dividends and capital gains, if any. Certain indices may take into account withholding taxes. Index returns do not represent Fund returns. The Index does not charge management fees or brokerage expenses, nor does the Index lend securities, and no revenues from securities lending were added to the performance shown.
The Morningstar® Wide Moat Focus IndexSM and Morningstar® US Small-Mid Cap Moat Focus IndexSM were created and are maintained by Morningstar, Inc. Morningstar, Inc. does not sponsor, endorse, issue, sell, or promote the VanEck Morningstar Wide Moat ETF or the VanEck Morningstar SMID Moat ETF and bears no liability with respect to the ETFs or any security. Morningstar® is a registered trademark of Morningstar, Inc. Morningstar® Wide Moat Focus IndexSM and Morningstar® US Small-Mid Cap Moat Focus IndexSM are service marks of Morningstar, Inc.
The Morningstar® US Broad Value Wide Moat Focus IndexSM is created and are maintained by Morningstar, Inc. Morningstar, Inc. does not sponsor, endorse, issue, sell, or promote the VanEck Morningstar Wide Moat Value ETF and bears no liability with respect to the Funds or any security. Morningstar® is a registered trademark of Morningstar, Inc. Morningstar® US Broad Value Wide Moat Focus IndexSM is a service mark of Morningstar, Inc.
Effective June 20, 2016, Morningstar implemented several changes to the Morningstar Wide Moat Focus Index construction rules. Among other changes, the index increased its constituent count from 20 stocks to at least 40 stocks and modified its rebalance and reconstitution methodology. These changes may result in more diversified exposure, lower turnover, and longer holding periods for index constituents than under the rules in effect prior to this date. Past performance is no guarantee of future results.
The Morningstar moat-driven indexes represent various regional exposures and consist of companies identified as having sustainable, competitive advantages and whose stocks are attractively priced, according to Morningstar.
The Morningstar® Wide Moat Focus IndexSM is intended to track the overall performance of attractively priced companies with sustainable competitive advantages according to Morningstar's equity research team.
The Morningstar® US Small-Mid Cap Moat Focus IndexSM is intended to track the overall performance of small- and mid-cap companies with sustainable competitive advantages and attractive valuations according to Morningstar's equity research team.
Morningstar® US Broad Value Wide Moat Focus IndexSM : consists of at least 30 U.S. value-oriented companies identified as having sustainable, competitive advantages, and whose stocks are the most attractively priced, according to Morningstar.
The S&P SmallCap 600 Index represents small-cap US companies. The S&P Midcap 400 Index provides investors with a benchmark for mid-sized US companies.The S&P 500 Index tracks the stock performance of 500 of the largest companies listed on stock exchanges in the United States. The S&P 500 Equal Weighted Index which is an equally weighted version of the market-cap weighted S&P 500 Index. The Dow Jones Industrial Average, Dow Jones, or simply the Dow, is a stock market index of 30 prominent companies listed on stock exchanges in the United States. Nasdaq Composite is a stock market index that includes almost all stocks listed on the Nasdaq stock exchange.
The S&P 500® Index is a product of S&P Dow Jones Indices LLC and/or its affiliates and has been licensed for use by Van Eck Associates Corporation. Copyright © 2026 S&P Dow Jones Indices LLC, a division of S&P Global, Inc., and/or its affiliates. All rights reserved. Redistribution or reproduction in whole or in part are prohibited without written permission of S&P Dow Jones Indices LLC. For more information on any of S&P Dow Jones Indices LLC’s indices please visit www.spdji.com. S&P® is a registered trademark of S&P Global and Dow Jones® is a registered trademark of Dow Jones Trademark Holdings LLC. Neither S&P Dow Jones Indices LLC, Dow Jones Trademark Holdings LLC, their affiliates nor their third party licensors make any representation or warranty, express or implied, as to the ability of any index to accurately represent the asset class or market sector that it purports to represent and neither S&P Dow Jones Indices LLC, Dow Jones Trademark Holdings LLC, their affiliates nor their third party licensors shall have any liability for any errors, omissions, or interruptions of any index or the data included therein.
An investment in the VanEck Morningstar Wide Moat ETF (MOAT® ) may be subject to risks which include, among others, risks related to investing in equity securities, health care sector, industrials sector, information technology sector, financials sector, medium-capitalization companies, market, operational, high portfolio turnover, index tracking, authorized participant concentration, no guarantee of active trading market, trading issues, passive management, fund shares trading, premium/discount risk and liquidity of fund shares, non-diversification and index-related concentration risks, all of which may adversely affect the Fund. Medium-capitalization companies may be subject to elevated risks.
An investment in the VanEck Morningstar SMID Moat ETF (SMOT® ) may be subject to risks which include, among others, risks related to investing in equity securities, small- and medium-capitalization companies, consumer discretionary sector, financials sector, health care sector, industrials sector, information technology sector, market, operational, high portfolio turnover, index tracking, authorized participant concentration, no guarantee of active trading market, trading issues, passive management, fund shares trading, premium/discount risk and liquidity of fund shares, non-diversified, and index-related concentration risks, all of which may adversely affect the Fund. Small- and medium-capitalization companies may be subject to elevated risks.
An investment in the VanEck Morningstar Wide Moat Value ETF (MVAL) may be subject to risks which include, among others, risks related to investing in equity securities, value style investing, financials sector, health care sector, industrials sector, large- and medium-capitalization companies, market, operational, index tracking, authorized participant concentration, new fund, no guarantee of active trading market, trading issues, passive management, fund shares trading, premium/discount and liquidity of fund shares, non-diversified, and index-related concentration risks, all of which may adversely affect the Fund. Large- and medium-capitalization companies may be subject to elevated risks. The Fund’s value strategy may result in the Fund investing in securities or industry sectors that underperform the market as a whole. Furthermore, the value companies identified by the Index provider may not operate as expected, and there is no guarantee that the index provider’s proprietary valuation model will perform as intended.
Investing involves substantial risk and high volatility, including possible loss of principal. An investor should consider the investment objective, risks, charges and expenses of a Fund carefully before investing. To obtain a prospectus and summary prospectus, which contain this and other information, call 800.826.2333 or visit vaneck.com. Please read the prospectus and summary prospectus carefully before investing.
© Van Eck Securities Corporation, Distributor, a wholly owned subsidiary of Van Eck Associates Corporation
Related Funds
Important Disclosures
Source for all data unless otherwise noted: Morningstar.
Fair value estimate: the Morningstar analyst's estimate of what a stock is worth. Price/Fair Value: ratio of a stock's trading price to its fair value estimate.
This is not an offer to buy or sell, or a recommendation to buy or sell any of the securities, financial instruments or digital assets mentioned herein. The information presented does not involve the rendering of personalized investment, financial, legal, tax advice, or any call to action. Certain statements contained herein may constitute projections, forecasts and other forward-looking statements, which do not reflect actual results, are for illustrative purposes only, are valid as of the date of this communication, and are subject to change without notice. Actual future performance of any assets or industries mentioned are unknown. Information provided by third party sources are believed to be reliable and have not been independently verified for accuracy or completeness and cannot be guaranteed. VanEck does not guarantee the accuracy of third party data. The information herein represents the opinion of the author(s), but not necessarily those of VanEck or its other employees.
Holdings will vary for the MOAT ETF and its corresponding Index. For a complete list of holdings in the ETF, please click here: https://www.vaneck.com/us/en/investments/morningstar-wide-moat-etf-moat/holdings/.
Holdings will vary for the SMOT ETF and its corresponding Index. For a complete list of holdings in the ETF, please click here: https://www.vaneck.com/us/en/investments/morningstar-smid-moat-etf-smot/holdings/.
Holdings will vary for the MVAL ETF and its corresponding Index. For a complete list of holdings in the ETF, please click here: https://www.vaneck.com/us/en/morningstar-wide-moat-value-etf-mval/holdings/.
An investor cannot invest directly in an index. Returns reflect past performance and do not guarantee future results. Results reflect the reinvestment of dividends and capital gains, if any. Certain indices may take into account withholding taxes. Index returns do not represent Fund returns. The Index does not charge management fees or brokerage expenses, nor does the Index lend securities, and no revenues from securities lending were added to the performance shown.
The Morningstar® Wide Moat Focus IndexSM and Morningstar® US Small-Mid Cap Moat Focus IndexSM were created and are maintained by Morningstar, Inc. Morningstar, Inc. does not sponsor, endorse, issue, sell, or promote the VanEck Morningstar Wide Moat ETF or the VanEck Morningstar SMID Moat ETF and bears no liability with respect to the ETFs or any security. Morningstar® is a registered trademark of Morningstar, Inc. Morningstar® Wide Moat Focus IndexSM and Morningstar® US Small-Mid Cap Moat Focus IndexSM are service marks of Morningstar, Inc.
The Morningstar® US Broad Value Wide Moat Focus IndexSM is created and are maintained by Morningstar, Inc. Morningstar, Inc. does not sponsor, endorse, issue, sell, or promote the VanEck Morningstar Wide Moat Value ETF and bears no liability with respect to the Funds or any security. Morningstar® is a registered trademark of Morningstar, Inc. Morningstar® US Broad Value Wide Moat Focus IndexSM is a service mark of Morningstar, Inc.
Effective June 20, 2016, Morningstar implemented several changes to the Morningstar Wide Moat Focus Index construction rules. Among other changes, the index increased its constituent count from 20 stocks to at least 40 stocks and modified its rebalance and reconstitution methodology. These changes may result in more diversified exposure, lower turnover, and longer holding periods for index constituents than under the rules in effect prior to this date. Past performance is no guarantee of future results.
The Morningstar moat-driven indexes represent various regional exposures and consist of companies identified as having sustainable, competitive advantages and whose stocks are attractively priced, according to Morningstar.
The Morningstar® Wide Moat Focus IndexSM is intended to track the overall performance of attractively priced companies with sustainable competitive advantages according to Morningstar's equity research team.
The Morningstar® US Small-Mid Cap Moat Focus IndexSM is intended to track the overall performance of small- and mid-cap companies with sustainable competitive advantages and attractive valuations according to Morningstar's equity research team.
Morningstar® US Broad Value Wide Moat Focus IndexSM : consists of at least 30 U.S. value-oriented companies identified as having sustainable, competitive advantages, and whose stocks are the most attractively priced, according to Morningstar.
The S&P SmallCap 600 Index represents small-cap US companies. The S&P Midcap 400 Index provides investors with a benchmark for mid-sized US companies.The S&P 500 Index tracks the stock performance of 500 of the largest companies listed on stock exchanges in the United States. The S&P 500 Equal Weighted Index which is an equally weighted version of the market-cap weighted S&P 500 Index. The Dow Jones Industrial Average, Dow Jones, or simply the Dow, is a stock market index of 30 prominent companies listed on stock exchanges in the United States. Nasdaq Composite is a stock market index that includes almost all stocks listed on the Nasdaq stock exchange.
The S&P 500® Index is a product of S&P Dow Jones Indices LLC and/or its affiliates and has been licensed for use by Van Eck Associates Corporation. Copyright © 2026 S&P Dow Jones Indices LLC, a division of S&P Global, Inc., and/or its affiliates. All rights reserved. Redistribution or reproduction in whole or in part are prohibited without written permission of S&P Dow Jones Indices LLC. For more information on any of S&P Dow Jones Indices LLC’s indices please visit www.spdji.com. S&P® is a registered trademark of S&P Global and Dow Jones® is a registered trademark of Dow Jones Trademark Holdings LLC. Neither S&P Dow Jones Indices LLC, Dow Jones Trademark Holdings LLC, their affiliates nor their third party licensors make any representation or warranty, express or implied, as to the ability of any index to accurately represent the asset class or market sector that it purports to represent and neither S&P Dow Jones Indices LLC, Dow Jones Trademark Holdings LLC, their affiliates nor their third party licensors shall have any liability for any errors, omissions, or interruptions of any index or the data included therein.
An investment in the VanEck Morningstar Wide Moat ETF (MOAT® ) may be subject to risks which include, among others, risks related to investing in equity securities, health care sector, industrials sector, information technology sector, financials sector, medium-capitalization companies, market, operational, high portfolio turnover, index tracking, authorized participant concentration, no guarantee of active trading market, trading issues, passive management, fund shares trading, premium/discount risk and liquidity of fund shares, non-diversification and index-related concentration risks, all of which may adversely affect the Fund. Medium-capitalization companies may be subject to elevated risks.
An investment in the VanEck Morningstar SMID Moat ETF (SMOT® ) may be subject to risks which include, among others, risks related to investing in equity securities, small- and medium-capitalization companies, consumer discretionary sector, financials sector, health care sector, industrials sector, information technology sector, market, operational, high portfolio turnover, index tracking, authorized participant concentration, no guarantee of active trading market, trading issues, passive management, fund shares trading, premium/discount risk and liquidity of fund shares, non-diversified, and index-related concentration risks, all of which may adversely affect the Fund. Small- and medium-capitalization companies may be subject to elevated risks.
An investment in the VanEck Morningstar Wide Moat Value ETF (MVAL) may be subject to risks which include, among others, risks related to investing in equity securities, value style investing, financials sector, health care sector, industrials sector, large- and medium-capitalization companies, market, operational, index tracking, authorized participant concentration, new fund, no guarantee of active trading market, trading issues, passive management, fund shares trading, premium/discount and liquidity of fund shares, non-diversified, and index-related concentration risks, all of which may adversely affect the Fund. Large- and medium-capitalization companies may be subject to elevated risks. The Fund’s value strategy may result in the Fund investing in securities or industry sectors that underperform the market as a whole. Furthermore, the value companies identified by the Index provider may not operate as expected, and there is no guarantee that the index provider’s proprietary valuation model will perform as intended.
Investing involves substantial risk and high volatility, including possible loss of principal. An investor should consider the investment objective, risks, charges and expenses of a Fund carefully before investing. To obtain a prospectus and summary prospectus, which contain this and other information, call 800.826.2333 or visit vaneck.com. Please read the prospectus and summary prospectus carefully before investing.
© Van Eck Securities Corporation, Distributor, a wholly owned subsidiary of Van Eck Associates Corporation