ETF 106: Debunking Fixed Income Myths
March 23, 2020
Read Time 6 MIN
ETF 101: Understanding the Basics
ETF 102: The Inner Workings of ETF Creations and Redemptions
ETF 103: Is This ETF Right for Your Portfolio?
ETF 104: Getting the Most Out of Your ETF Trades
ETF 105: Gain Efficient Access to Bond Markets with Fixed Income ETFs
ETF 106: Debunking Fixed Income Myths
ETF 107: Passive vs. Active ETFs Explained
1. In volatile markets or a fixed income selloff, ETF liquidity will evaporate and the ETF structure will be stressed and broken.
There is a perception that features of the ETF structure can result in investors being uniquely harmed or susceptible to suffering more than investors who access the market through other vehicles, such as a mutual funds or separately managed accounts. The rationale behind this argument rests on the fear that there may be any buyers of the ETF during times of market stress that authorized participants may not be willing to facilitate creations and redemptions, or that portfolio managers will be forced sellers of the underlying securities due to the passive nature of most ETF investment strategies. In reality, investors in fixed income ETFs should be no worse off than investors who use other types of investment vehicles, and may actually benefit from the features of an ETF in times of market stress.
It is true that the liquidity of an ETF is ultimately driven by the liquidity of the fund’s underlying bonds. If there are significant net buyers or sellers, then ETF shares may be created or redeemed through the creation/redemption process. In this process, an authorized participant buys or sells cash bonds in the primary market which they deliver (in the case of a creation) or receive (in the case of a redemption) in exchange for shares of the ETF. Although the liquidity of underlying bonds can diminish in times of market stress, ETF investors benefit from an additional layer of liquidity that is not found in other vehicles such as mutual funds or SMAs. That layer is the secondary market trading of the ETF itself. Because shares of the ETF can also trade between buyers and sellers on an exchange, there is often no need for a creation or redemption and, therefore, no need for an authorized participant to trade the underlying bonds. This is particularly true for larger ETFs. Historically, in times of volatility, fixed income ETF trading volumes have actually increased, even as trading in the underlying bonds has decreased. This dual source of liquidity has benefitted ETF investors, who have been able to transact at tight bid/ask spreads under normal circumstances and have been able to transact still at reasonable spreads in times of stress.
In a scenario in which there is net selling of ETF shares, ETF market makers would likely be the ultimate buyers. They may choose to hold the ETF shares on their books, so that they have shares in their inventory when volatility recedes and/or buyers re-emerge. If there are no buyers and the market makers are unwilling to hold ETF shares in inventory, they might proceed to redeem their shares. Because in a redemption scenario bonds are delivered in-kind, a redemption would not lead to the ETF portfolio manager being forced to sell bonds. Mutual fund portfolio managers, on the other hand, would be compelled to sell portfolio holdings in order to satisfy redemptions, or else maintain a significant cash position at all times to guard against such events. The ETF market maker may sell some or all of the bonds received from a redemption, but also has the ability to choose when to sell based on market conditions if they are seeking to minimize the price impact. This is in stark contrast to mutual funds or separate accounts, where bonds must be sold to satisfy redemptions. Not only does that need increase the likelihood of excess downward pressure on prices, further hurting returns, but it also exposes investors remaining in the mutual fund to the transaction costs involved in meeting the redemption, and in times of high stress those transaction costs can be very high. While these forced sellers’ actions will likely have an impact on valuations across the entire fixed income market, ETF investors are at least partially shielded from having to realize these losses due to the dual liquidity mechanism, the inherent flexibility of the creation/redemption process and the more equitable allocation of trading costs to those who choose to transact in volatile market environments. Those transaction costs are effectively estimated by the market maker bidding the ETF shares and are priced in to the quote they make. Therefore the transaction cost is borne first by the selling shareholder and then transferred to the market maker. The ETF and its remaining shareholders typically do not bear this cost.
Lastly, this myth fails to recognize the flexibility that portfolio managers of fixed income ETFs have, which can help to facilitate redemptions more efficiently. Fixed income ETFs often use representative sampling to match the characteristics of an index, rather than fully replicating the index, which might include several hundred or thousands of individual bonds. Instead, portfolio managers replicate the key risk and return drivers of the index with a smaller subset of bonds, and have flexibility to decide which bonds to buy or sell as long as the overall portfolio continues to represent the overall index. Liquidity and trading costs are a key factor in determining which bonds to include in the ETF’s portfolio. Further, redemption baskets often contain far fewer securities than the overall portfolio holds, which helps to facilitate redemptions more efficiently with authorized participants.
2. Active outperforms across the fixed income space, and is even more pronounced in the “less efficient” high yield, EM and bank loan markets.
The idea that passive fixed income ETFs are bound to underperform because of their design is simply not supported by actual fund performance. In fact, among actively managed bond funds, over 70%1 underperformed their asset class benchmark over the past five years. The figures are even bleaker for managers of high yield and emerging markets bond funds, whereby 96%2 of active managers underperformed over that period. Even in the bank loan space, nearly 70% of active managers underperformed. Although we would agree that the loan market has unique operational considerations in which an active manager can add value in times of volatility, these figures show how difficult it is to outperform low cost passive strategies.
Percentage of U.S. Actively Managed Funds that Underperformed Their Benchmark:
| Fund Category | Comparison Index | 5 YR (%) | 3 YR (%) | 1 YR(%) |
|---|---|---|---|---|
| High-Yield | Barclays High Yeild | 95.99 | 91.94 | 82.91 |
| Global Income | Barclays Global Aggregate | 59.48 | 33.64 | 44.12 |
| Emerging Markets Debt | Barclays Emerging Markets | 96.15 | 66.67 | 79.63 |
| Loan Participation | S&P/LSTA U.S. Leveraged Loan 100 Index | 68.09 | 85.71 | 100 |
| General Municipal Debt | S&P National AMT-Free Municipal Bond | 58.75 | 69.14 | 82.67 |
Source: S&P Dow Jones Indices as of 6/30/2019.
Why is underperformance not a foregone conclusion with fixed income ETFs? First, a well-designed index should represent the composition and returns of the investable opportunity set, and an ETF tracking such a benchmark should therefore provide market beta exposure. By definition, this should be somewhere around the average performance for the category. On the other hand, active managers who stray far from the market benchmark have the potential to outperform, but many will underperform as a result of their active bets. Second, higher fees can push more active strategies into the “underperforming” category. The average passively managed U.S. fixed income ETF net expense ratio was 24 basis points as of December 31, 20193, compared to an average of 89 basis points for actively managed U.S. mutual funds. It is also worth noting that indexes can be designed to potentially outperform the broad market if they are based on strategies which capture unique value or segment the market differently. In other words, an intelligently designed rules-based strategy can potentially provide higher returns, lower risk, or both. Such strategies may also underperform broader benchmarks, but they are less likely to suffer from such afflictions as high turnover and style drift; the portfolio managers are tasked with tracking their index and so are incentivized to remain highly disciplined. As shown below, passive fixed income strategies offered by VanEck in “less efficient” asset classes have performed as intended, providing category median or better performance since inception.
VanEck ETF Performance Relative to Peer Groups Since Inception (As of 12/31/2019)
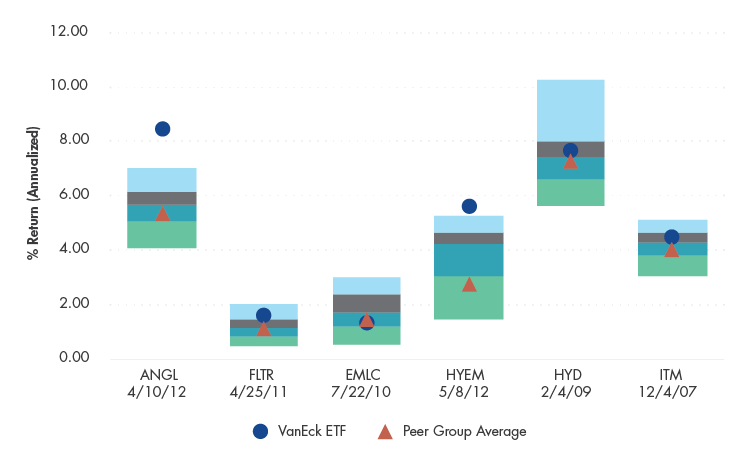
Performance data quoted represents past performance which is no guarantee of future results and which may be lower or higher than current performance. Performance current to the most recent month end available by calling 800.826.2333 or by visiting vaneck.com. Investment returns and ETF share values will fluctuate so that investors’ shares, when redeemed, may be worth more or less than their original cost. ETF returns assume that dividends and capital gains distributions have been reinvested in the Fund at NAV.
As described above, the secondary layer of liquidity provided by the ETF wrapper means that shares of the ETF can be exchanged without having to transact in the underlying bonds. And portfolio managers have many tools available to avoid forced selling that may occur in other structures such as mutual funds and separately managed accounts. For example, constructing optimized portfolios means that portfolio managers have flexibility to balance trading costs against and tracking error risk, and can avoid less liquid bonds if they believe it is the best course of action. In addition, the composition of redemption baskets can facilitate efficient redemptions to limit market impact.
3. Traditional index structure gives you the greatest exposure to the most indebted companies and ultimately more risk.
Historically, fixed income market benchmarks were constructed to provide a broad representation of the returns and composition of an asset class or market segment. That generally means inclusion of all bonds, or at least those with a face amount above a certain threshold, issued in a given market weighted by the value of those bonds. However, these indices were not necessarily designed to be investable. The Bloomberg Barclays U.S. Aggregate Bond Index, for example, has almost 11,000 bonds, which would be almost impossible to fully replicate in a cost efficient way.
With the growth of fixed income ETFs, index construction has increasingly emphasized investability. In addition to incorporating rules to enhance liquidity and reduce trading costs, indices can also be designed to provide diversification and reduce risk. Issuer or sector constraints (i.e., weighting caps) are a common feature among indices tracked by fixed income ETFs. For example, the J.P. Morgan GBI-EM Global Core Index, which is comprised of emerging markets sovereign bonds denominated in local currencies, features a 10%4 maximum weight to any single country. This has the impact of limiting exposure to larger issuers and increasing exposure to smaller ones, providing enhanced diversification. The result of incorporating caps, floors and other rules to increase diversification and limit risk is that passive strategies need not provide pure market capitalization weighted exposure, but rather a diversified and investable representation of a desired market exposure.
Actively managed strategies, in contrast, tend to exhibit lower diversification because portfolios generally reflect a portfolio managers views relative to the market benchmark. By nature, they may have higher concentrations of risk in certain sectors or issuers than the “modified market capitalization” benchmarks that the majority of fixed income ETFs track.
4. Increasing fixed income ETF utilization will distort prices and value on individual bonds (ETF tail will wag the Fixed Income market dog)
Global fixed income ETF assets under management hit the $1 trillion milestone in 2019, and ended the year at approximately $1.2 trillion5. The growth in the space has been impressive, almost tripling in size compared to just five years ago. However, when viewed in the context of the $103 trillion global bond market, it’s clear that ETFs still make up a very small part of the market compared to other investment vehicles, and fears about a disproportionate impact on security prices may be misplaced. U.S. Fixed income ETF assets total $840 billion6, making up a significant share of the U.S. market, but still only compiling a small fraction of the $41 trillion U.S. bond market.
In terms of the “investable” bond market, as measured by market benchmarks which include, among other rules, minimum issue sizes for inclusion, the story is similar. This is true even in asset classes that are generally considered less liquid, such as emerging markets bonds and high yield.
Percentage of U.S. Actively Managed Funds that Underperformed Their Benchmark
| Investable Universe | ETF AUM | ETF % | |
|---|---|---|---|
| All Global Fixed Income | 44,229,129,792,070 | 1,168,431,608,994 | 2.6% |
| Global IG Corporate | 7,793,373,692,187 | 170,274,079,189 | 2.2% |
| Global High Yield | 1,912,407,457,997 | 85,622,402,413 | 4.5% |
| US IG Corporate | 6,325,675,517,804 | 101,336,213,620 | 1.6% |
| US High Yield | 1,629,983,178,332 | 63,451,936,837 | 3.9% |
| USD Emerging Markets Sovereign | 1,153,300,412,716 | 41,763,543,325 | 3.6% |
| Local Currency Emerging Markets | 1,291,614,713,619 | 22,387,221,371 | 1.7% |
| US Muni | 1,614,070,000,000 | 42,783,240,667 | 2.7% |
| US High Yeild Muni | 127,817,000,000 | 4,844,022,769 | 3.8% |
Source: J.P. Morgan for investable universe and Morningstar for ETF market size, as of 12/31/2019. All Global Fixed Income is represented by the J.P. Morgan Global Aggregate Bond Index. Global IG Corporate is represented by the corporate investment grade bond segment of the J.P. Morgan Global Aggregate Bond Index. Corporate High Yield is represented by the corporate high yield bond segment of the J.P. Morgan Global Aggregate Bond Index. US IG Corporate is represented by the corporate investment grade segment of the J.P. Morgan Global Aggregate Bond US Index. Corporate High Yield is represented by the corporate high yield bond segment of the J.P. Morgan Global Aggregate Bond US Index. USD Emerging Markets Sovereign is represented by the J.P. Morgan EMBI Global Index. Local Currency Emerging Markets is represented by the J.P. Morgan GBI-EM Global Index. US Muni is represented by the Bloomberg Barclays Municpal Bond Index. US High Yield Muni is represented by the Bloomberg Barclays High Yield Municipal Bond Index.
5. Premiums and discounts indicate that ETFs are mispriced and investors are not paying a fair price.
An ETF’s net asset value (NAV) provides investors with a daily valuation of the underlying portfolio, while the market price is the price investors actually pay or receive to buy or sell shares of the ETF. These values can, and often do, diverge for various reasons, creating premiums or discounts versus NAV. Demand to buy or sell an ETF may create premiums and discounts, although these divergences are typically limited by the ability of authorized participants to arbitrage any meaningful differences if the premium or discount exceeds the costs associated with creating or redeeming shares. In some asset classes, such as domestic equity ETFs, premiums and discounts are generally very limited because the ETF and underlying portfolios trade during the same time and NAVs are based on closing prices of the underlying securities. In addition, low trading costs keep the costs of creating and redeeming shares low. Premiums and discounts can be more meaningful in international equities where the ETF and underlying securities do not trade at the same time.
In fixed income, there are additional factors that can lead to premiums and discounts. At a very basic level, the wider bid-ask spreads that are observed in the bond market means there are higher costs for authorized participants to create and redeem shares, and therefore more room for market prices to diverge from the NAV compared to asset classes such as domestic equities. In addition, since underlying bonds may not trade frequently, their values are often based on valuations from third party sources that reflect changes in various drivers of bond prices, for example changes in interest rates or credit spreads, but do not reflect an actual traded price for those bonds. On the other hand, a market maker may price an ETF based on their own assessment of where they could actually transact in the underlying securities, and account for additional factors such as the cost of borrowing or illiquidity in the underlying securities.
In times of market volatility, premiums and discounts may be more pronounced as market makers price ETFs based on their real-time assessment of the bonds’ values, compared to stale NAVs from a pricing service that may not reflect current market conditions. For example, a discount to NAV in times of heavy selling may reflect the cost of immediate liquidity for those who need to sell their shares in times of market stress. The key point is that premiums and discounts, particularly in fixed income ETFs, can generally be explained by both structural differences in the calculations of market prices and NAVs, and furthermore are often driven by the fact that market prices move faster than the valuations that NAVs are based on. As a result, premiums and discounts should not always be regarded as “bad.” Market prices may actually reflect a better assessment of real time value.
Similar to premiums and discounts resulting in differences between NAVs and market prices, fixed income ETF investors should also consider potential differences between the calculation of an ETF’s NAV and its index value. Differences between the two values can represent tracking error, but may also reflect differences in calculation methodologies. For example, index providers may use different pricing sources than the ETF’s NAV, or they may use different observations (e.g. 4PM London time versus 4PM New York time for a currency value). An index may use a bid price while a NAV uses mid pricing. Further, indexes don’t account for fees or trading costs, and typically bond indices do not account for withholding tax on foreign income or capital gains, while NAVs incorporate all of these costs.
Related Topics
Related Insights

DISCLOSURES
1 Source: S&P Dow Jones Indices, as of June 30, 2019.
2 Source: S&P Dow Jones Indices, as of June 30, 2019.
3 Source: Morningstar as of 12/31/2019.
4 Source: J.P. Morgan.
5 Source: Morningstar, as of 12/31/2019.
6 Morningstar as of 12/31/2019
The S&P 500 Index is a product of S&P Dow Jones Indices LLC and/or its affiliates and has been licensed for use by Van Eck Associates Corporation. Copyright©2019 S&P Dow Jones Indices LLC, a division of S&P Global, Inc., and/or its affiliates. All rights reserved. Redistribution or reproduction in whole or in part are prohibited without written permission of S&P Dow Jones Indices LLC. For more information on any of S&P Dow Jones Indices LLC’s indices please visit www.spdji.com. S&P®is a registered trademark of S&P Global and Dow Jones®is a registered trademark of Dow Jones Trademark Holdings LLC. Neither S&P Dow Jones Indices LLC, Dow Jones Trademark Holdings LLC, their affiliates nor their third party licensors make any representation or warranty, express or implied, as to the ability of any index to accurately represent the asset class or market sector that it purports to represent and neither S&P Dow Jones Indices LLC, Dow Jones Trademark Holdings LLC, their affiliates nor their third party licensors shall have any liability for any errors, omissions, or interruptions of any index or the data included therein.
This is not an offer to buy or sell, or a solicitation of any offer to buy or sell any of the securities mentioned herein. The information presented does not involve the rendering of personalized investment, financial, legal, or tax advice. Certain statements contained herein may constitute projections, forecasts and other forward looking statements, which do not reflect actual results, are valid as of the date of this communication and subject to change without notice. Information provided by third party sources are believed to be reliable and have not been independently verified for accuracy or completeness and cannot be guaranteed. The information herein represents the opinion of the author(s), but not necessarily those of VanEck.
The principal risks of investing in VanEck ETFs include sector, market, economic, political, foreign currency, world event, index tracking and non-diversification risks, as well as fluctuations in net asset value and the risks associated with investing in less developed capital markets. The Funds may loan their securities, which may subject them to additional credit and counterparty risk.
ETFs that invest in high-yield securities are subject to subject to risks associated with investing in high-yield securities; which include a greater risk of loss of income and principal than funds holding higher-rated securities; concentration risk; credit risk; hedging risk; interest rate risk; and short sale risk. Investors should be willing to accept a high degree of volatility and the potential of significant loss. High yield bonds may be subject to greater risk of loss of income and principal and are likely to be more sensitive to adverse economic changes than higher rated securities. Investors should be willing to accept a high degree of volatility and the potential of significant loss. Please see the prospectus of each Fund for more complete information regarding each Fund's specific risks.
The “Net Asset Value” (NAV) of a VanEck Exchange Traded Fund (ETF) is determined at the close of each business day, and represents the dollar value of one share of the fund; it is calculated by taking the total assets of the fund, subtracting total liabilities, and dividing by the total number of shares outstanding. The NAV is not necessarily the same as the ETF’s intraday trading value. VanEck ETF investors should not expect to buy or sell shares at NAV.
Fund shares are not individually redeemable and will be issued and redeemed at their NAV only through certain authorized broker-dealers in large, specified blocks of shares called "creation units" and otherwise can be bought and sold only through exchange trading. Shares may trade at a premium or discount to their NAV in the secondary market. You will incur brokerage expenses when trading Fund shares in the secondary market. Past performance is no guarantee of future results. Returns for actual Fund investments may differ from what is shown because of differences in timing, the amount invested, and fees and expenses.
Investing involves substantial risk and high volatility, including possible loss of principal. Bonds and bond funds will decrease in value as interest rates rise. An investor should consider the investment objective, risks, charges and expenses of the Fund carefully before investing. To obtain a prospectus and summary prospectus, which contains this and other information, call 800.826.2333 or visit vaneck.com. Please read the prospectus and summary prospectus carefully before investing.
Related Insights
September 27, 2019
Execute ETF trades as cost efficiently as possible by sticking to these important trading best practices.
September 13, 2019
September 03, 2019
The creation and redemption process is a fundamental feature of the ETF structure. Learn how this process works and its role in driving liquidity and tax efficiency for investors.
August 15, 2019
Related Funds
DISCLOSURES
1 Source: S&P Dow Jones Indices, as of June 30, 2019.
2 Source: S&P Dow Jones Indices, as of June 30, 2019.
3 Source: Morningstar as of 12/31/2019.
4 Source: J.P. Morgan.
5 Source: Morningstar, as of 12/31/2019.
6 Morningstar as of 12/31/2019
The S&P 500 Index is a product of S&P Dow Jones Indices LLC and/or its affiliates and has been licensed for use by Van Eck Associates Corporation. Copyright©2019 S&P Dow Jones Indices LLC, a division of S&P Global, Inc., and/or its affiliates. All rights reserved. Redistribution or reproduction in whole or in part are prohibited without written permission of S&P Dow Jones Indices LLC. For more information on any of S&P Dow Jones Indices LLC’s indices please visit www.spdji.com. S&P®is a registered trademark of S&P Global and Dow Jones®is a registered trademark of Dow Jones Trademark Holdings LLC. Neither S&P Dow Jones Indices LLC, Dow Jones Trademark Holdings LLC, their affiliates nor their third party licensors make any representation or warranty, express or implied, as to the ability of any index to accurately represent the asset class or market sector that it purports to represent and neither S&P Dow Jones Indices LLC, Dow Jones Trademark Holdings LLC, their affiliates nor their third party licensors shall have any liability for any errors, omissions, or interruptions of any index or the data included therein.
This is not an offer to buy or sell, or a solicitation of any offer to buy or sell any of the securities mentioned herein. The information presented does not involve the rendering of personalized investment, financial, legal, or tax advice. Certain statements contained herein may constitute projections, forecasts and other forward looking statements, which do not reflect actual results, are valid as of the date of this communication and subject to change without notice. Information provided by third party sources are believed to be reliable and have not been independently verified for accuracy or completeness and cannot be guaranteed. The information herein represents the opinion of the author(s), but not necessarily those of VanEck.
The principal risks of investing in VanEck ETFs include sector, market, economic, political, foreign currency, world event, index tracking and non-diversification risks, as well as fluctuations in net asset value and the risks associated with investing in less developed capital markets. The Funds may loan their securities, which may subject them to additional credit and counterparty risk.
ETFs that invest in high-yield securities are subject to subject to risks associated with investing in high-yield securities; which include a greater risk of loss of income and principal than funds holding higher-rated securities; concentration risk; credit risk; hedging risk; interest rate risk; and short sale risk. Investors should be willing to accept a high degree of volatility and the potential of significant loss. High yield bonds may be subject to greater risk of loss of income and principal and are likely to be more sensitive to adverse economic changes than higher rated securities. Investors should be willing to accept a high degree of volatility and the potential of significant loss. Please see the prospectus of each Fund for more complete information regarding each Fund's specific risks.
The “Net Asset Value” (NAV) of a VanEck Exchange Traded Fund (ETF) is determined at the close of each business day, and represents the dollar value of one share of the fund; it is calculated by taking the total assets of the fund, subtracting total liabilities, and dividing by the total number of shares outstanding. The NAV is not necessarily the same as the ETF’s intraday trading value. VanEck ETF investors should not expect to buy or sell shares at NAV.
Fund shares are not individually redeemable and will be issued and redeemed at their NAV only through certain authorized broker-dealers in large, specified blocks of shares called "creation units" and otherwise can be bought and sold only through exchange trading. Shares may trade at a premium or discount to their NAV in the secondary market. You will incur brokerage expenses when trading Fund shares in the secondary market. Past performance is no guarantee of future results. Returns for actual Fund investments may differ from what is shown because of differences in timing, the amount invested, and fees and expenses.
Investing involves substantial risk and high volatility, including possible loss of principal. Bonds and bond funds will decrease in value as interest rates rise. An investor should consider the investment objective, risks, charges and expenses of the Fund carefully before investing. To obtain a prospectus and summary prospectus, which contains this and other information, call 800.826.2333 or visit vaneck.com. Please read the prospectus and summary prospectus carefully before investing.
Related Insights
September 27, 2019
Execute ETF trades as cost efficiently as possible by sticking to these important trading best practices.
September 13, 2019
September 03, 2019
The creation and redemption process is a fundamental feature of the ETF structure. Learn how this process works and its role in driving liquidity and tax efficiency for investors.
August 15, 2019