VanEck Mid-August 2026 Bitcoin ChainCheck
August 18, 2026
Read Time 10+ MIN
Please note that VanEck has exposure to bitcoin.
Key takeaways
- Bitcoin steadied as volatility collapsed: BTC closed August 11 at $63,549, essentially flat month over month (-0.3%), while 30-day realized volatility eased to 27.2% annualized, well under the long-run average near 80%.
- 8 of 12 capitulation signals are firing: the dashboard points to a late-stage drawdown, though forward returns from these clusters have beaten the bitcoin baseline only at the 1-year horizon, on a small and heavily overlapping sample.
- Long-term holders sold into strength: coins held longer than a year fell 356k BTC (-2.9%) to 11.84M BTC, pushing the long-term supply share back under 60% for the first time in months.
Bitcoin Steadies Off the Summer Low as Long-Term Holders Sell Into Strength
BTC Price and 200-Day Moving Average

Source: Artemis XYZ. As of 8/12/2026. Past performance is not a guarantee of future results. Not intended as a recommendation to buy or sell any securities named herein.
Bitcoin (BTC) spent the past 30 days stabilizing after recovering off its June summer low. BTC closed August 11 at $63,549, essentially flat versus a month ago (-0.3%), while the 30-day moving average (MA) rose to about $64,322 (+2.6% m/m) as higher July prints replaced the washed-out June readings. Price held a tight $62,265 to $66,509 band (low July 13, high July 21), and 30-day realized volatility eased further to 27.2% annualized, below last month’s 30.4% and well under the long-run average near 80%. The steadier tape suggests the decline that ran through spring has stopped, with BTC potentially bottoming near $58,500 on June 30. Currently, BTC price is about 9% below its 200-day MA (roughly $69,884), a narrower gap than the 14% discount a month ago as the trailing average rolled lower and price held its ground. Measured against its all-time high (ATH), BTC still sits about 49% below the peak.
US spot bitcoin exchange-traded products (ETPs) took in roughly +$663M on a net basis over the past 30 days, or about +$22M per day, equal to about +10,400 BTC at current prices, a clear reversal from the prior month when spot ETPs shed roughly 40,010 BTC (about -$2.40B) and dominated the negative flow picture.
Bitcoin trading slowed to a crawl through the dog days of summer. Spot volume stayed subdued, with the trailing 30-day total down 27% m/m and sitting in only the 10th percentile of its history. From a spot trading perspective, the summer of 2026 is an outlier as volumes are at ~2023 bear-market levels and this year’s seasonal drop is far deeper than the ones in 2024 or 2025. We read price action somewhat positively as prices have held despite a continuing onslaught of bad news: long-term rates hitting highs not seen since 2007, the Iran/US conflict persisting into its 5th month, and Strategy (formerly MicroStrategy) selling more of its bitcoin to shore up its preferred security.
We Are Approaching the End of the Correction Phase
Bitcoin Price Cycles


Source: Artemis XYZ, VanEck Research. As of 8/12/2026. Past performance is not a guarantee of future results. Not intended as a recommendation to buy or sell any securities named herein.
Bitcoin enthusiasts have posited that bitcoin price goes through cycles that align with the halving of mining rewards every 4 years. The assumption is that the reduction in mining rewards going to miners removes consistent sell pressure as more efficient miners with stronger balance sheets take control of the network and hold coins. Additionally, it is assumed that the reduction in supply on schedule alongside continued resilience of the network, if proven out through the reduction, means Bitcoin’s economic system remains intact. Finally, there is supposition that those who’d like to mine BTC but no longer can economically will direct their resources to purchasing BTC on the open market rather than obtaining BTC through running a mining operation. Regardless of the cause, many assume a 4-year price cycle.
Bitcoin Capitulation by Cycle (Pre-2026)
| Cycle | Peak date | Peak price ($) | Trough date | Trough price ($) | Drawdown | Peak to trough (months) | Defining capitulation events |
| 2011 | Jun 2011 | $32 | Nov 2011 | $2 | -94% | 5 | Mt. Gox June 2011 hack; MyBitcoin vanishes (~154k BTC); Bitcoinica, Tradehill |
| 2013–15 | Nov–Dec 2013 | $1,150 | Jan 2015 | $175 | -85% | 14 | Mt. Gox collapse (Feb 2014, ~850k BTC missing); Silk Road seizure; Butterfly Labs |
| 2017–18 | Dec 17, 2017 | $19,700 | Dec 15, 2018 | $3,200 | -84% | 12 | BitConnect implodes (Jan 2018); broad ICO wipeout; Bitmain distress and layoffs |
| 2021–22 | Nov 10, 2021 | $69,000 | Nov 21, 2022 | $15,500 | -78% | 12 | Terra/LUNA (May); Three Arrows Capital (Jun–Jul); Celsius, Voyager; FTX/Alameda (Nov); BlockFi, Genesis; Core Scientific, Compute North |
Source: VanEck Research. As of 8/12/2026. Past performance is not a guarantee of future results. Not intended as a recommendation to buy or sell any securities named herein.
The data supports this assertion: we count 4 previous cycles and are currently in the 5th. From peak to maximum drawdown, the bear phase has averaged 11 months. That average is pulled down by 2011, which ran only 5 months on a market that barely existed. Excluding 2011, the last 3 cycles averaged 12.7 months, with 2013-15 at 14 months and the 2 most recent at 12 each. We are entering the 10th month of the drawdown from the peak bitcoin price in October 2025. On the full-sample average, the next accumulation phase begins in September. On the ex-2011 average it lands in October or November, which is where those calling for an October 2026 bottom get their date. We would rather show the range than pick the earlier number.
Bitcoin Capitulation Check

Source: Artemis XYZ. As of 8/12/2026. Percentiles calculated against the full available history of each metric, daily observations. Extremes reflect the trailing 90 days. Past performance is not a guarantee of future results. Not intended as a recommendation to buy or sell any securities named herein.
Today 8 of 12 signals are firing while all 12 reached their capitulation zone at some point in the last 3 months. Signals fire when the latest reading sits in the extreme 15th percentile or below (or 90th and above) of its history. The one exception is price drawdown, which we fire at ≤ -35% rather than on a percentile basis. We flag that choice because it is doing real work. At -49.0% the drawdown sits in the 35th percentile of its own history and would not fire on the percentile rule, which would put us at 7 of 12 rather than 8 of 12. We use the absolute threshold deliberately. Prior troughs of -94%, -85%, -84%, and -78% were set in a market with no spot ETP bid, a far smaller institutional holder base, and a leveraged lender complex that failed outright in every one of those cycles. This cycle has had no Celsius, no Three Arrows Capital (3AC), and no FTX. We expect a shallower trough as a result, and we would rather state that assumption plainly than hide it inside a threshold.
We expect a shallower trough this cycle, and we would rather state that assumption plainly than hide it inside a threshold.
Bitcoin Capitulation Forward Returns: Bottom 20% Percentile Readings
Mean returns: forward BTC by # indicators in Bottom 20 Percentile Readings

Source: Artemis XYZ. As of 8/12/2026. Past performance is not a guarantee of future results. Not intended as a recommendation to buy or sell any securities named herein.
If we look at historical data to assess forward returns from capitulation, the record is mixed and we want to be direct about where it is weak. At 8-12 indicators firing, mean 90d returns of 12.8% and mean 180d returns of 32.0% both come in below the 15.2% and 36.3% baselines. The cohort only beats at 1yr. One caveat applies to that column: with 115 observation days that overlap heavily, the 1yr readings draw on a small number of distinct episodes rather than a distribution. We show it for completeness and we do not underwrite it heavily.
- We have witnessed what appears to be bitcoin price capitulation.
- We are nearing or currently in an accumulation phase.
- Forward returns from BTC buys around capitulation have exceeded typical BTC price action at 1yr in prior cycles, on a small sample. Inside of six months, the historical record gives us no edge.
When these signals sit toward the upper end of their ranges, they suggest flattish price action over longer periods.
Bitcoin Capitulation Forward Returns: Top 20% Percentile Readings
Mean returns: forward BTC by # indicators in TOP 20%

Source: Artemis XYZ. As of 8/12/2026. Past performance is not a guarantee of future results. Not intended as a recommendation to buy or sell any securities named herein.
Puts Stay Bid as Implied Vol Collapses, Perp Funding Normalizes
BTC Options Premium Paid (30d): Total $789.3M, +21% m/m (Calls + Puts)


Source: Glassnode. As of 8/11/2026. Past performance is not a guarantee of future results. Not intended as a recommendation to buy or sell any securities named herein.
As with typical summers, implied volatility across all options cheapened while many market participants remained defensive and bid up the price of puts. Total premium paid (calls + puts) rose 21% m/m to $789.3M (66th percentile since 2021) with the entire increase coming from downside hedging through puts. Put premiums jumped 42% to $551.8M (89th percentile) while call premiums fell 10% m/m to $237.6M, pushing the Put/Call premium ratio to an all-time-extreme 2.30 (99th percentile) against a norm of 0.71.
However, positioning, as measured by open interest (OI), tilted further toward calls. Total options open interest held near $29.9B (79th percentile) as call OI rose 5% to $19.1B and put OI fell 11.5% to $10.8B. This drops the Put/Call OI ratio to 0.57 from 0.67. One way to read this odd dynamic (puts written up, but put OI down) is that older puts are rolling off against calls, as they are likely shorter dated. This likely reflects puts being far more expensive than calls, with institutions taking advantage of the changing volatility structure to minimize hedging costs.
Implied volatility (IV) stayed near record lows, with one-month call IV at 32.7% (0th percentile since 2021) and put IV near 40%. Meanwhile, the put/call skew eased to +7.2pp from +11.4pp one month earlier. The skew, or the difference between put and call IV, is lower than it has been in recent months, but still above the +4.2pp average since 2021 and well above the +1.3pp of a year ago.
In perpetual futures (perps), funding rates have normalized back to positive territory. The one-month funding rate held low-positive at +4.7% annualized (versus +4.5% a month ago), with the trailing week cooling to +3.8%, roughly half the +8.4% long-run average. This funding rate is a clear shift from the spring when longs were paid to hold positions through a negative perp funding rate. When funding rates are positive, perp prices are higher than equivalent spot prices and longs pay an interest rate penalty to the shorts. This mechanism encourages longs to close positions, bringing the perp price back in line with the spot price.
Perp open interest ticked up 4.5% m/m to about $30.7B. Liquidations quieted on both sides, down about half, with longs forced out at $0.51B and shorts at $0.47B. Forced selling fell to its lowest level in months.
Onchain: Long-Term Holders Distribute Into the Recovery
Holdings by Age Cohort (BTC)
| Past Month by Band — Aged Holders Are Moving Coins as >1yr holdings drop 2.9% m/m | ||||||||
| Band | Holdings Begin (BTC) | Holdings End (BTC) | Δ 30d (%) | Δ 30d (BTC) | (+) Aged-In (BTC) | (−) Aged-Out (BTC) | (−) Transferred (BTC) | Implied Δ (in−out−tf) |
| 1y_2y | 2,522,735 | 2,365,990 | (6.2%) | (156,746) | 2,935,214 | 1,636,298 | 1,455,662 | (156,746) |
| 2y_3y | 1,108,731 | 1,032,481 | (6.9%) | (76,249) | 1,636,298 | 1,064,879 | 647,668 | (76,249) |
| 3y_5y | 1,944,720 | 1,882,853 | (3.2%) | (61,867) | 1,064,879 | 583,133 | 543,613 | (61,867) |
| 5y_7y | 1,434,381 | 1,407,868 | (1.8%) | (26,513) | 583,133 | 355,140 | 254,506 | (26,513) |
| 7y_10y | 1,660,121 | 1,629,414 | (1.8%) | (30,707) | 355,140 | 35,454 | 350,393 | (30,707) |
| more_10y | 3,525,607 | 3,521,155 | (0.1%) | (4,453) | 35,454 | 0 | 39,906 | (4,453) |
| Total >1y | 12,196,295 | 11,839,761 | (2.9%) | (356,534) | 2,935,214 | 0 | 3,291,748 | (356,534) |
Source: Glassnode. As of 8/11/2026. Past performance is not a guarantee of future results. Not intended as a recommendation to buy or sell any securities named herein.
Underneath the price stabilization, long-term holders (>1yr coins) moved coins out at an elevated rate. Coins held longer than a year fell about 356k BTC over the 30 days (-2.9%) to 11.84M BTC. This represents the first meaningful monthly drawdown of the long-term cohort in months against an average monthly change near zero over the prior year. The selling was broad, with all six long-term bands shrinking, but front-loaded in the younger and middle vintages: the 1y-2y band shed about 156k BTC (-6.2%), 2y-3y lost about 76k BTC (-6.9%), and 3y-5y gave up about 62k BTC (-3.2%). By contrast, the oldest coins barely moved, with the >10y band down just ~4k BTC (-0.1%).
Turnover, the share of a band’s coins that were transferred, accelerated across the middle of the age curve, up 83% m/m for the 3-5-year band, 129% for the 7-10-year band, and 27% for the 5-7-year band, with the 7-10-year cohort spending at about 2.2x its own six-year norm. The oldest and youngest long-term coins went the other way: >10y turnover fell to just 1.1% of that band, the lowest spending rate of any age group, and the 1-2-year band eased 16%. Of the roughly 3.3M BTC of aged (>1y) coins that moved over the month, about 44% came from the 1-2-year band and only about 12% from coins older than seven years. Because a nearly equal amount of younger coins crossed the one-year mark to replace what moved, the long-term base is churning in place more than it is collapsing, but the net direction turned lower for the first time in months.
The clearest shift from prior months is the long-term supply share slipping below 60%. Coins untouched for over a year now equal 11.84M BTC, or 59.1% of circulating supply. After grinding higher through the spring at roughly 0.4 percentage points a month, from 59.2% six months ago to 60.9% in July, the share has turned down and crossed back under the 60% line for the first time in months as holders moved coins. The offsetting force is still in place: about 3.33M BTC, roughly 16.6% of supply, sits in the 6-to-12-month band and would lift the long-term share again if it ages past the one-year mark without being spent.
Coins untouched for over a year now equal 11.84M BTC, or 59.1% of circulating supply, back under the 60% line for the first time in months.
Typically, we would read such a jump in coin movement as bearish. There is a competing explanation we want to put on the table without overselling it. The Coldcard hack of more than 1,800 BTC in July and August 2026 exposed weak random number generation that could affect other wallet providers, and with AI-assisted attack tooling proliferating, long-term holders reading about it may have moved balances for safety rather than for sale. We would note the size mismatch before leaning on this: 1,800 BTC of confirmed loss against 356k BTC of net aged-coin movement is not a proportionate cause, and the mechanism we are proposing is behavioral contagion, which is hard to falsify. The test we would apply is whether aged coins moved without a corresponding rise in exchange inflows. Prophylactic migration shows up as wallet-to-wallet transfers; distribution shows up on venue. We flag this as an open question and will report the exchange inflow split by age band next month.
BTC Supply Held Longer Than 1 Year (Share of Circulating)
BTC Held >1 Year as % of Supply at LT Avg: 59%


Source: Glassnode. As of 8/11/2026. Past performance is not a guarantee of future results. Not intended as a recommendation to buy or sell any securities named herein.
Bitcoin Miners: Hash Economics Remain Underwater
Bitcoin Network Revenue Per Day
Daily Miner Revenue -46% y/y


Source: Glassnode. As of 8/11/2026. Past performance is not a guarantee of future results. Not intended as a recommendation to buy or sell any securities named herein.
Network hash rate averaged roughly 885 exahashes per second (EH/s) over the week to August 11, against a trailing 30-day average near 897 EH/s. Network mining difficulty now sits about 18.3% below its November 2025 peak, the largest drawdown since the 2021 China ban and an 8th-percentile reading, which tells us sustained negative economics have forced marginal operations offline. The Puell Multiple, which compares daily issuance value to its yearly average, has averaged about 0.73 over the past 30 days, in the 16th percentile. We would flag that the August 8 adjustment moved difficulty higher by 1.0%, the first upward print of this sequence, with hash rate recovering toward 925 EH/s since.
Bitcoin Miners: The Batch Zero Selloff
Last month when investor fears centered around the potential for rising rates to compress the value of bitcoin miners pivoting to AI, we estimated a “valuation floor” for WULF that stripped out all terminal value and uncontracted pipeline potential for the company. We found that the company’s three signed leases alone supported a share price in the high-teens, meaning the market was ascribing almost nothing to a pipeline that includes a 1 GW Kentucky site, a 1 GW Maryland site, and additional New York capacity (albeit delayed by the NY moratorium). Interestingly, we also found that even a ~200bps increase in rates only reduced the value of these contracted cash flows by a mid-single-digit percentage, meaning that the real gap in perceived value for these companies lay in the terminal values.
While July was about rates and hyperscaler return-on-invested-capital (ROIC) skepticism, August’s early drawdown in the BTC-to-AI cohort was led by renewed uncertainty around the “speed to power” premium, thanks to delays in Batch Zero, the process the Electric Reliability Council of Texas (ERCOT) uses to evaluate large-load interconnection requests as a group and allocate grid capacity among them.
On August 3, Governor Abbott directed state regulators to audit data centers moving through the ERCOT interconnection process, a move that pushed the clarity companies expected on August 7 to an indefinite date. This came at a time when many companies were reporting earnings and had minimal information on what to expect beyond the headlines. While there have been a few more recent updates including more than 20 advanced projects expecting to energize in early 1H27 to remain on schedule, and potential clarity at an August 20 open meeting, many names have sold off as audits could take “several months”. As we refreshed our valuations at the current prices and especially noticed HUT trading close to the value of its signed leases (with no terminal value ascribed), we think this creates opportunistic entry points to add to some TX-exposed names. We would also point out that a meaningful share of the capacity that sold off has no exposure to the batch process at all, which we take up in the CIFR discussion below.
Strong Demand Continues to Drive Lease Value Higher
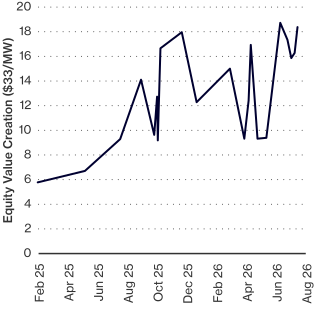
As shown below, equity value created per megawatt (MW) for bitcoin miners has trended steadily higher across recent announced leases, from roughly $6M/MW in early 2025 to mid-teens today. WULF’s June announcement set the current high near $19M/MW, and RIOT’s pending deal could reset it depending on final financing terms ($500M raised to date, with the equity portion funded off the existing AMD agreement). The process has validated the demand side: these are signed 15-year-plus leases with investment-grade counterparties, and CIFR management described the current environment as the strongest they have seen, with higher rents, longer terms, and more triple-net structures. For context on the headroom, DLR has been clearing stabilized capacity near $27M/MW and Blackstone’s BXDC buy box implies acquisitions around $15M/MW, though those are asset-level prices against our equity-value-created figures, so we would not draw a clean ratio between them.
Equity Value Created per MW Across Recent Announced Bitcoin Miner Leases

Source: Bloomberg, VanEck Research. As of 8/11/2026. Past performance is not a guarantee of future results. Not intended as a recommendation to buy or sell any securities named herein.
We ran the same exercise as we did on WULF last month to exclude terminal values and uncontracted pipelines for CIFR and HUT. HUT screens best, trading near the lower band of the present value of its existing cash flows, with terminal value and a ~9 GW pipeline close to free. CIFR is more fully priced on its signed leases, but holds 477 MW of leasable capacity outside the Batch process and has been the most transparent to date on its future pipeline.
CIFR: Across CIFR’s 3 existing leases, which management expects to generate roughly $793M of average annualized net operating income (NOI) from October 2026 through September 2036, we estimate equity value of $3.1B when excluding the terminal value of these sites. When including the terminal values, to which we apply a 10x multiple on final-year cash flows, we estimate $7.0B of equity value (compared to a stock price of $17.21 and market cap of $7.1B as of 8/11). At today’s price the market is paying for the signed leases and little else, which leaves the 477 MW at Odessa, Reveille, and Ulysses as free optionality. Management stated on the Q2 call that all three have cleared the major interconnection milestones, are leasable now, and sit outside the batch process, with Odessa already energized at 207 MW. Executing them would raise MWs under contract by roughly 70%. Applying the mid-teens equity value per MW that recent deals have cleared, haircut for probability and a 2-year build, adds roughly $4.3B, or about $10 per share. Upside is then further supported by one of the largest known Batch Zero pipelines: approximately 5.3 GW across 11 sites, of which about 4.4 GW is future development, plus the newly optioned Apollo site near San Antonio for up to 900 MW, submitted as a studied load.
At today’s price the market is paying CIFR for its signed leases and little else, which leaves 477 MW at Odessa, Reveille, and Ulysses as free optionality.
HUT: Across HUT’s 3 existing leases, which are expected to drive an average annual NOI of nearly $1.8B across the life of the combined leases, we estimate equity value of $9.7B when excluding the terminal value of these sites. When including the terminal values, to which we apply the same 10x multiple on final-year cash flows, we estimate $18.5B of equity value (compared to a stock price of $88.78 and market cap of $10.9B as of 8/11). At $10.9B, the stock trades just 12% above our ex-terminal floor and at 59% of our full estimate, so the terminal value and the ~9 GW pipeline are close to free at today’s price. HUT has also shown it can fund this without touching equity, issuing two investment-grade project bonds totaling $7.5B and pricing the second tighter than the first. We see meaningful upside as it delivers on these contracts and begins to execute against the pipeline.
As such, we remain constructive on both names for different reasons. HUT offers the larger margin of safety, trading close to the value of its contracted book. CIFR is the catalyst position, where a signed lease at Reveille or Ulysses reprices the stock without ERCOT resolving anything, and a Batch Zero reopening on anything like the original timeline is upside on top of that.
Assumptions
HUT: We estimate the net present value (NPV) of free cash flows for each lease by subtracting build capex, spread evenly across the lease term, and 3% annual maintenance capex from contracted annual NOI, then discounting each year back at a weighted average cost of capital (WACC).
Our WACC assumptions comprise a 95% debt / 5% equity capital structure, a 20% tax rate, and a 7.50% pre-tax cost of debt (8.00% for RiverBend), yielding a blended WACC of 6.5% (6.9% for RiverBend), consistent with the ~95% loan-to-cost, non-recourse project bonds HUT has actually issued at 6.13-6.19%, above which our cost of debt assumption sits conservatively. Our 15.5% cost of equity is driven by a 5.0% equity risk premium over a 4.5% risk-free rate and a beta of 2.2. Our terminal value estimate applies a 10x multiple to the final contracted year’s cash flow for each lease, consistent with a 3% terminal growth rate and a 13% WACC, held conservatively high relative to the 6.5% WACC used to discount the contracted cash flows.
CIFR: We estimate the NPV of free cash flows for each lease by subtracting build capex, spread evenly across the lease term, and 3% annual maintenance capex from contracted annual NOI, then discounting each year back at a WACC.
Our WACC assumptions comprise an 80% debt / 20% equity capital structure, a 20% tax rate, and a 6-7.75% pre-tax cost of debt (varies by lease), yielding a blended WACC of 7-8%, though CIFR’s most recent project bond (Stingray) priced at 6% and 8x oversubscribed, so the low end of that range is the better forward anchor. Our 15.5% cost of equity is driven by a 5.0% equity risk premium over a 4.5% risk-free rate and a beta of 2.2. Our terminal value estimate applies a 10x multiple to the final contracted year’s cash flow for each lease, consistent with a 3% terminal growth rate and a 13% WACC, held conservatively high relative to the 7-8% WACC used to discount the contracted cash flows.
Frequently Asked Questions
What is a bitcoin capitulation signal?
A capitulation signal is an onchain or market indicator whose latest reading sits at a historical extreme, typically the 15th percentile or below (or the 90th and above), suggesting that sellers have largely exhausted themselves. Common examples include the MVRV Z-Score, net unrealized profit/loss (NUPL), the Puell Multiple, and the share of supply held in profit. As of August 12, 2026, 8 of the 12 signals tracked here were firing, and all 12 had reached their capitulation zone at some point in the prior 3 months.
How long do bitcoin bear markets usually last?
Across the 4 completed cycles since 2011, the peak-to-trough phase has averaged 11 months. Excluding 2011, when the market barely existed, the last 3 cycles averaged 12.7 months, with 2013-15 running 14 months and the 2 most recent running 12 months each. The drawdown from the October 2025 peak entered its 10th month in August 2026, which places the historical range for a transition into accumulation between September and November 2026.
Why are long-term bitcoin holders selling?
Coins held longer than a year fell about 356k BTC, or -2.9%, over the 30 days to August 11, 2026, the first meaningful monthly drawdown of the long-term cohort in months. The selling concentrated in the 1y-2y, 2y-3y, and 3y-5y bands rather than in the oldest coins, which points to profit-taking and portfolio churn more than a wholesale exit. Security-driven wallet migration following the July 2026 Coldcard firmware exploit may account for some movement, though the roughly 1,800 BTC of confirmed loss is small relative to 356k BTC of net aged-coin movement.
To receive more Digital Assets insights, sign up in our subscription center.


Disclosures
Definitions
Bitcoin (BTC) is a decentralized digital currency without a central bank or single administrator. It can be sent from user to user on the peer-to-peer Bitcoin network without intermediaries.
MVRV Z-Score compares bitcoin’s market value to its realized value, standardized by the standard deviation of market value, and is used to identify periods when the asset is trading well above or below its aggregate cost basis.
Net unrealized profit/loss (NUPL) measures the aggregate paper profit or loss held across all bitcoin in circulation, expressed as a share of market capitalization.
Adjusted spent output profit ratio (aSOPR) measures the average realized profit or loss on coins moved onchain, excluding coins held for less than one hour. Readings below 1.0 indicate coins are being spent at a loss.
Puell Multiple divides the daily US dollar value of newly issued bitcoin by its 365-day moving average, and is used to assess miner revenue relative to its own history.
Hash rate is the total computational power committed to mining and processing transactions on the Bitcoin network, measured here in exahashes per second (EH/s).
Perpetual futures (perps) are derivative contracts without an expiry date that track an underlying asset through a periodic funding payment exchanged between long and short positions.
Implied volatility (IV) is the market’s expectation of future price variability, derived from options prices.
Risk Considerations
This is not an offer to buy or sell, or a recommendation to buy or sell any of the securities, financial instruments or digital assets mentioned herein. The information presented does not involve the rendering of personalized investment, financial, legal, tax advice, or any call to action. Certain statements contained herein may constitute projections, forecasts and other forward-looking statements, which do not reflect actual results, are for illustrative purposes only, are valid as of the date of this communication, and are subject to change without notice. Actual future performance of any assets or industries mentioned are unknown. Information provided by third party sources are believed to be reliable and have not been independently verified for accuracy or completeness and cannot be guaranteed. VanEck does not guarantee the accuracy of third party data. The information herein represents the opinion of the author(s), but not necessarily those of VanEck or its other employees.
Index performance is not representative of fund performance. It is not possible to invest directly in an index.
Investments in digital assets and Web3 companies are highly speculative and involve a high degree of risk. These risks include, but are not limited to: the technology is new and many of its uses may be untested; intense competition; slow adoption rates and the potential for product obsolescence; volatility and limited liquidity, including but not limited to, inability to liquidate a position; loss or destruction of key(s) to access accounts or the blockchain; reliance on digital wallets; reliance on unregulated markets and exchanges; reliance on the internet; cybersecurity risks; and the lack of regulation and the potential for new laws and regulation that may be difficult to predict. Moreover, the extent to which Web3 companies or digital assets utilize blockchain technology may vary, and it is possible that even widespread adoption of blockchain technology may not result in a material increase in the value of such companies or digital assets.
Digital asset prices are highly volatile, and the value of digital assets, and Web3 companies, can rise or fall dramatically and quickly. If their value goes down, there’s no guarantee that it will rise again. As a result, there is a significant risk of loss of your entire principal investment.
Digital assets are not generally backed or supported by any government or central bank and are not covered by FDIC or SIPC insurance. Accounts at digital asset custodians and exchanges are not protected by SPIC and are not FDIC insured. Furthermore, markets and exchanges for digital assets are not regulated with the same controls or customer protections available in traditional equity, option, futures, or foreign exchange investing.
Digital assets include, but are not limited to, cryptocurrencies, tokens, NFTs, assets stored or created using blockchain technology, and other Web3 products.
Web3 companies include but are not limited to, companies that involve the development, innovation, and/or utilization of blockchain, digital assets, or crypto technologies.
All investing is subject to risk, including the possible loss of the money you invest. As with any investment strategy, there is no guarantee that investment objectives will be met and investors may lose money. Diversification does not ensure a profit or protect against a loss in a declining market. Past performance is no guarantee of future performance.
© Van Eck Associates Corporation.
Disclosures
Definitions
Bitcoin (BTC) is a decentralized digital currency without a central bank or single administrator. It can be sent from user to user on the peer-to-peer Bitcoin network without intermediaries.
MVRV Z-Score compares bitcoin’s market value to its realized value, standardized by the standard deviation of market value, and is used to identify periods when the asset is trading well above or below its aggregate cost basis.
Net unrealized profit/loss (NUPL) measures the aggregate paper profit or loss held across all bitcoin in circulation, expressed as a share of market capitalization.
Adjusted spent output profit ratio (aSOPR) measures the average realized profit or loss on coins moved onchain, excluding coins held for less than one hour. Readings below 1.0 indicate coins are being spent at a loss.
Puell Multiple divides the daily US dollar value of newly issued bitcoin by its 365-day moving average, and is used to assess miner revenue relative to its own history.
Hash rate is the total computational power committed to mining and processing transactions on the Bitcoin network, measured here in exahashes per second (EH/s).
Perpetual futures (perps) are derivative contracts without an expiry date that track an underlying asset through a periodic funding payment exchanged between long and short positions.
Implied volatility (IV) is the market’s expectation of future price variability, derived from options prices.
Risk Considerations
This is not an offer to buy or sell, or a recommendation to buy or sell any of the securities, financial instruments or digital assets mentioned herein. The information presented does not involve the rendering of personalized investment, financial, legal, tax advice, or any call to action. Certain statements contained herein may constitute projections, forecasts and other forward-looking statements, which do not reflect actual results, are for illustrative purposes only, are valid as of the date of this communication, and are subject to change without notice. Actual future performance of any assets or industries mentioned are unknown. Information provided by third party sources are believed to be reliable and have not been independently verified for accuracy or completeness and cannot be guaranteed. VanEck does not guarantee the accuracy of third party data. The information herein represents the opinion of the author(s), but not necessarily those of VanEck or its other employees.
Index performance is not representative of fund performance. It is not possible to invest directly in an index.
Investments in digital assets and Web3 companies are highly speculative and involve a high degree of risk. These risks include, but are not limited to: the technology is new and many of its uses may be untested; intense competition; slow adoption rates and the potential for product obsolescence; volatility and limited liquidity, including but not limited to, inability to liquidate a position; loss or destruction of key(s) to access accounts or the blockchain; reliance on digital wallets; reliance on unregulated markets and exchanges; reliance on the internet; cybersecurity risks; and the lack of regulation and the potential for new laws and regulation that may be difficult to predict. Moreover, the extent to which Web3 companies or digital assets utilize blockchain technology may vary, and it is possible that even widespread adoption of blockchain technology may not result in a material increase in the value of such companies or digital assets.
Digital asset prices are highly volatile, and the value of digital assets, and Web3 companies, can rise or fall dramatically and quickly. If their value goes down, there’s no guarantee that it will rise again. As a result, there is a significant risk of loss of your entire principal investment.
Digital assets are not generally backed or supported by any government or central bank and are not covered by FDIC or SIPC insurance. Accounts at digital asset custodians and exchanges are not protected by SPIC and are not FDIC insured. Furthermore, markets and exchanges for digital assets are not regulated with the same controls or customer protections available in traditional equity, option, futures, or foreign exchange investing.
Digital assets include, but are not limited to, cryptocurrencies, tokens, NFTs, assets stored or created using blockchain technology, and other Web3 products.
Web3 companies include but are not limited to, companies that involve the development, innovation, and/or utilization of blockchain, digital assets, or crypto technologies.
All investing is subject to risk, including the possible loss of the money you invest. As with any investment strategy, there is no guarantee that investment objectives will be met and investors may lose money. Diversification does not ensure a profit or protect against a loss in a declining market. Past performance is no guarantee of future performance.
© Van Eck Associates Corporation.