Neocloud Sell-Off Leaves Bitcoin Miners Oversold
November 04, 2026
Read Time 10+ MIN
Please note that VanEck may have a position(s) in the digital asset(s) and companies
Key takeaways
- Powered shell providers sold off on funding fears, not lost leases: Powered shell providers (PSPs) fell an average of ~35% in October on rate and credit concerns, yet no signed leases across our public companies were cancelled. Demand signals, including hyperscaler capex, chip sales and compute prices, kept rising.
- Power, not chips, is the binding constraint on AI: Only ~2% of the ~2,290 gigawatts (GW) in the US interconnection queue reached commercial operation in 2025, and Morgan Stanley projects a 38GW US data center shortfall through 2028, which raises the value of energized power.
- Valuations sit well below real estate peers: On 2028 estimates, the group trades at roughly half the enterprise value-to-EBITDA (EV/EBITDA) multiple of data center real estate investment trusts (REITs), and at stabilized real estate cap rates (5-7%), signed leases alone appear to support values above current prices.
A powered shell is an energized, grid-connected building or site that a tenant fills with its own computing equipment. The companies that lease them, powered shell providers (PSPs), are sometimes called colocation operators. October's sell-off treated three very different AI infrastructure business models as a single trade, so it helps to be clear on who is who before getting into what happened.
Powered Shell Providers, Neoclouds and Hyperscalers: Who Sells, Owns and Finances What
| Powered shell provider (PSP) Includes many of the bitcoin miners that have pivoted to AI data centers | Neocloud GPU rental companies | Hyperscaler The big cloud platforms | |
| What it is | An infrastructure landlord that provides the power and buildings AI data centers run in | A specialized cloud provider built around renting GPUs for AI workloads | A massive cloud platform offering a full range of computing services, with AI as one part of the business |
| Examples | Hut 8, Core Scientific, TeraWulf, Cipher, IREN* | CoreWeave, Lambda, Nebius, IREN* | AWS, Microsoft Azure, Google Cloud |
| Sells | Powered space | GPU compute | Broad cloud services, including GPU compute and managed AI tools |
| Owns | Land, power access, building | GPUs and related hardware | Data centers, GPUs and custom chips, plus leased capacity |
| Customers | Neoclouds, hyperscalers, AI labs | AI labs, startups, hyperscalers | Enterprises, developers, AI labs |
| Closest analogy | Commercial landlord | Equipment rental business | Department store |
| Financing | Shorter term construction debt refinanced into long-term real estate debt over 15 to 20 years | Chip loans over 3 to 4 years | Mostly operating cash flow, plus corporate debt |
*IREN appears in both columns. Like many PSPs, it is a former bitcoin miner with energized, grid-connected sites, but it has chosen to buy GPUs and sell compute directly under shorter contracts, which puts its business model and financing closer to a neocloud. Other companies may also span more than one category; examples shown are classified by primary business model and are not exhaustive. Source: VanEck. Not intended as a recommendation to buy or sell any securities named herein.
What Happened in October
Powered shell providers (PSPs) fell an average of ~35% in October as concerns about their ability to raise debt surfaced, a hotter-than-expected September consumer price index (CPI) revived rate-hike expectations and raised funding costs, and regulatory uncertainty mounted ahead of the November 3 midterms. The group was hit harder than the broader AI complex as contagion fears spread from neoclouds to anyone building AI infrastructure. That said, underlying supply and demand remain strong, and the power these companies control appears to be the binding constraint on AI compute. At current levels we believe these stocks appear significantly dislocated from fundamentals given their long-term contracted cash flows.
- Rising rates and tighter credit triggered the sell-off: The October de-rating accelerated with hawkish macro (rising oil prices leading to higher rate expectations) and higher AI debt yields (CoreWeave (CRWV) bonds near 15% vs coupons under ~10%), while no signed leases across our public companies were cancelled.
- Powered shell providers run a differet business model from neoclouds: We believe the market is not distinguishing between the two and their significantly different risks. PSPs sign 10-20 year leases often backed by investment-grade (IG) tenants, while CoreWeave’s average contract runs ~2-5 years. Many PSPs also mine bitcoin, which allows them to earn on pipeline land before AI sites are ready, a factor we believe the market currently assigns no value to.
- Demand still exceeds supply: Chip manufacturers continue to raise expectations, reports of “powerless” graphics processing units (GPUs) are surfacing, hyperscaler capex is rising next year, and consensus estimates continue to point to a significant US power shortfall through 2028.
- Supply is getting scarcer: Electric Reliability Council of Texas (ERCOT)’s Batch Zero audit, local opposition across the country, and midterms continue to elevate the uncertainty around when and how future capacity will come online. As such, the value of energized/approved power should be higher, not lower, in our view.
- The math still works at higher rates: While the cost of funding is stepping up, pricing remains a lever that enables powered shell providers to maintain a yield on capex well above its funding costs, providing a strong return. We expect an increasing mix of IG counterparties (vs AI labs) on this next tranche of leases, which supports enough demand to exceed the available supply.
Why the Stocks Sold Off
The PSPs are trading as a leverage bet on rates and AI credit rather than on fundamentals, which is partly fair given their reliance on the debt markets to grow, but means these stocks are swinging heavily on macro news rather than company news. There have been no lease cancellations or AI capex cuts while demand continues o grow, indicating to us that this is a de-rating rather than a broken thesis. Tax-loss selling and pre-election positioning amplified the move, leaving our PSP group ~62% off its 2026 highs and ~35% lower since the end of September.
This is a de-rating, not a broken thesis.
What the Market Fears Versus Our Read, by Driver
| Driver | What the market fears | Fundamental or sentiment? | Our read |
| Rates / inflation | Hotter CPI and higher oil revive hike risk; higher discount rates hit long-duration assets | Sentiment, with real cost impact | Raises cost of capital; does not change lease cash flows already signed |
| AI credit repricing | Neocloud bonds trading at ~15% yields; can tenants fund their build? | Partly fundamental | Real for neocloud-tenant leases; much less for hyperscaler-backed ones |
| AI capex / ROI doubts | Will returns justify the build-out in aggregate? | Sentiment so far | No hyperscaler has cut capex; chip suppliers continue to raise guidance |
| Policy / NIMBY | ERCOT Batch Zero audit, state pushback | Fundamental, but cuts both ways | Delays new supply, which supports value of sites already energized |
| Positioning | PSPs remain one of the most traded and hedged pockets of the AI trade | Technical | Crowding explains the size of the drawdown, not its cause |
Source: VanEck analysis as of 10/30/26. Past performance is not a guarantee of future results. Not intended as a recommendation to buy or sell any securities named herein. For illustrative purposes only. Not a projection of future results.
PSP Drawdowns: 2026 High to 10/30/26 Close
| Ticker | 2026 high | 10/30 close | Off high (%) | YTD (%) | Since 9/30 (%) | Since 10/13 (%) |
| POWERED SHELL PROVIDERS | ||||||
| CIFR | $29.18 (6/18) | $7.29 | −75 | −51 | −54 | −36 |
| HUT | $133.02 (6/2) | $59.40 | −55 | +29 | −31 | −29 |
| WULF | $28.98 (6/18) | $11.73 | −60 | +2 | −21 | −11 |
| APLD | $49.65 (5/28) | $17.82 | −64 | −27 | −27 | −21 |
| CORZ | $29.16 (6/18) | $13.25 | −55 | −9 | −17 | −14 |
| KEEL | $6.66 (6/22) | $2.06 | −69 | −13 | −42 | −28 |
| BTDR | $19.71 (6/3) | $6.71 | −66 | −40 | −36 | −27 |
| CLSK | $18.81 (6/1) | $7.67 | −59 | −24 | −40 | −24 |
| RIOT | $28.69 (6/23) | $12.81 | −55 | +1 | −36 | −23 |
| MARA | $14.85 (6/1) | $6.77 | −54 | −25 | −40 | −26 |
| IREN | $67.84 (5/27) | $23.95 | −65 | −37 | −41 | −31 |
| HIVE | $4.90 (6/22) | $1.91 | −61 | −26 | −36 | −20 |
| WYFI | $44.77 (6/22) | $10.36 | −77 | −34 | −42 | −29 |
| GLXY | $34.31 (1/16) | $16.00 | −53 | −28 | −30 | −19 |
| Median / avg | −60 / −62 | −25 / −20 | −36 / −35 | −25 / −24 | ||
| COMPARISONS | ||||||
| CRWV | $137.98 (5/6) | $54.87 | −60 | −31 | −37 | −29 |
| NBIS | $286.69 (6/18) | $154.14 | −46 | +84 | −35 | −25 |
| DLR | $203.91 (4/20) | $180.70 | −11 | +17 | +3 | +1 |
| EQIX | $1,115.94 (6/22) | $1,013.70 | −9 | +32 | 0 | −1 |
Source: Bloomberg as of 10/30/2026. Past performance is not a guarantee of future results. Not intended as a recommendation to buy or sell any securities named herein. For illustrative purposes only. Not a projection of future results.
Demand Remains Robust
Hard demand signals we measure continue to rise, including hyperscaler capex, chip sales and compute prices. The bear case has shifted from “will they spend on AI?” to “can they fund it?”, which is a cost-of-capital question rather than a concern about underlying demand.
- GPU pricing continues to rise: Sources continue to report that hourly GPU pricing is rising across all generations.
- SpaceX (SPCX) sells GPU compute capacity and is seeing spot pricing drive revenue >$50B per GW per year, above its prior range of $30-50B given just last quarter
- Nebius (NBIS) released a live prices dashboard of GPUs, providing transparency to customers and supporting the value of its compute
- A Commodity Futures Trading Commission (CFTC) decision around futures markets could be a catalyst, giving investors greater visibility into operators’ ability to sustain pricing against higher funding costs, and a hedging tool for neoclouds and AI companies to limit downside
GPU Rental Prices Keep Rising: B200 and H100 Hourly Rates, October 2025 to October 2026
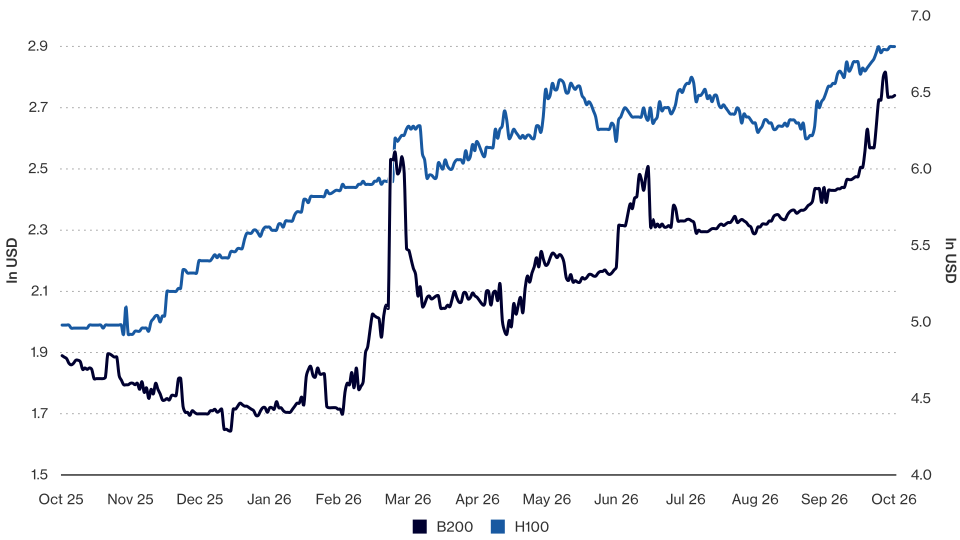
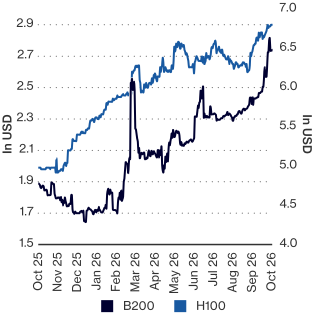
Source: Bloomberg, Silicon Data as of 10/30/26. White line (left axis): Silicon Data B200 Rental Price Index (SDB200RT). Blue line (right axis): Silicon Data H100 Neo-Cloud Rental Price Index (SDH100RT). Both in US dollars per GPU-hour. Index performance is not representative of fund performance. It is not possible to invest directly in an index. Past performance is not a guarantee of future results. Not intended as a recommendation to buy or sell any securities named herein.
- Hyperscaler spend continues to go up: Despite no indication that hyperscalers will cut their expected capex, the market is beginning to price PSPs as if they are likely to. In fact, we think there is more potential for these names to increase their expected capex, as new use cases could unlock step function changes in their compute needs.
- Meta’s Muse app has far exceeded downloads and daily active users (DAUs) from ChatGPT, Claude and Grok in its early days. The company sees significant efficiencies to its advertising business with AI and large commerce opportunity with Muse.
- Amazon (AMZN) expects AWS growth of >40% in 2027 and 2028 towards a $1T business, fueled by its investments in AI.
Muse Cumulative Downloads Reach 10.9M in 42 Days
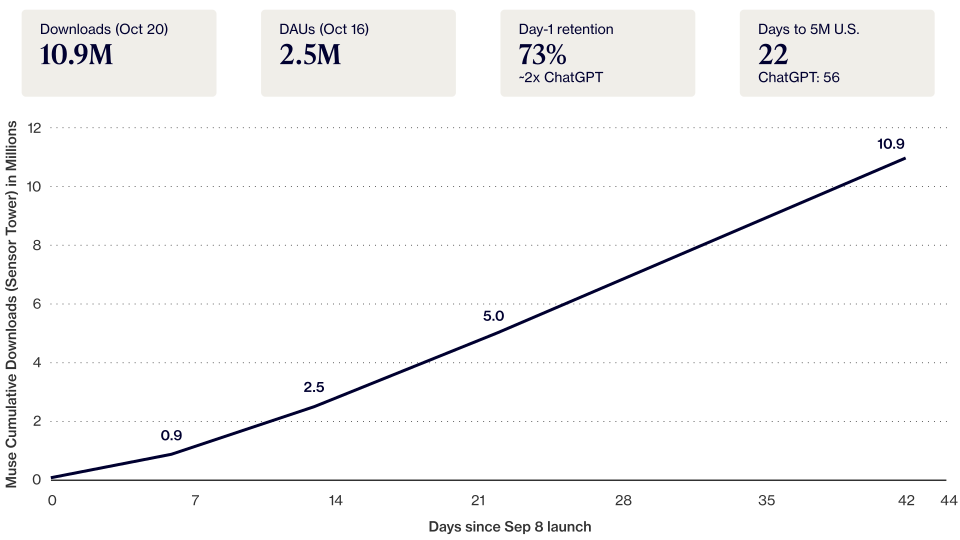
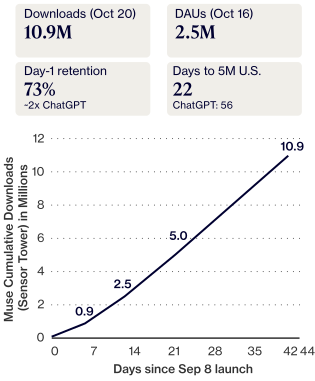
Source: Sensor Tower as of 10/20/2026. Past performance is not a guarantee of future results. Not intended as a recommendation to buy or sell any securities named herein. For illustrative purposes only. Not a projection of future results.
- Chips are selling out: Chipmakers continue to sell out their capacity through the coming years, while hyperscalers are accelerating their plans to deploy their own chips.
- Microsoft (MSFT) Maia chips: On October 12, MSFT said it will scale its in-house Maia accelerators to multi-gigawatt deployments starting in 2027, making Maia the primary inference system of its own products.
- Taiwan Semiconductor (TSMC) and Broadcom (AVGO) both raised revenue significantly in the most recent quarter on the back of extremely robust multi-year AI demand.
- Productivity anecdotes: Studies and surveys across the enterprise landscape continue to suggest that AI usage is leading to meaningful productivity unlocks.
- MSFT recently offered >25% of its workforce voluntary buyouts as it looks to cut costs and transform its business for the AI world.
Supply: Power Is the Constraint and Energized Megawatts Are Getting Scarcer are getting scarcer
- While the headline pipeline for power coming online looks massive, very little of it can be built on a useful timeline given the supply chain constraints and limited pool of labor in key regions. Rising delays and costs make existing energized capacity more valuable, and expansions at existing sites carry lower execution risk.
- Bernstein’s August tracker showed 404GW of North American pipeline but only 170GW likely to be built, while Morgan Stanley projects a 38GW US DC shortfall through 2028
- Missing a power date is a stock-killing event, and the market is showing investors how much energized power is worth: Australia’s NextDC fell ~40% after cutting FY27 revenue and EBITDA by one-third when one site did not receive power on time, while Nscale’s initial public offering (IPO) valuation is in question following delays and customer losses due to grid connection timelines.
- AMZN sitting on idle GPUs: Business Insider reported on October 20 that AWS plans to take early delivery of ~$5B NVIDIA (NVDA) GB300 server racks, with ~$3B more a month to follow, all while finished equipment is sitting in warehouses because several AWS sites lack the capacity to energize it.
The US interconnection queue is too slow to deliver new power on a useful timeline: In 2025, only 53GW of the ~2,290GW queue reached commercial operation, a ~2% throughput rate, and ~14x more capacity was withdrawn than built. The median project now takes 61 months from request to operation, up from 22 months in 2008. Only ~13% of queued projects historically have been built, and ~41% are withdrawn even after an interconnection agreement is signed. We see this as a moat for PSPs with clear paths to already-energized power, as competitors without it face years of delay and a high risk of attrition.
In 2025, only 53GW of the ~2,290GW queue reached commercial operation, a ~2% throughput rate.
The Queue Is Not a Pipeline
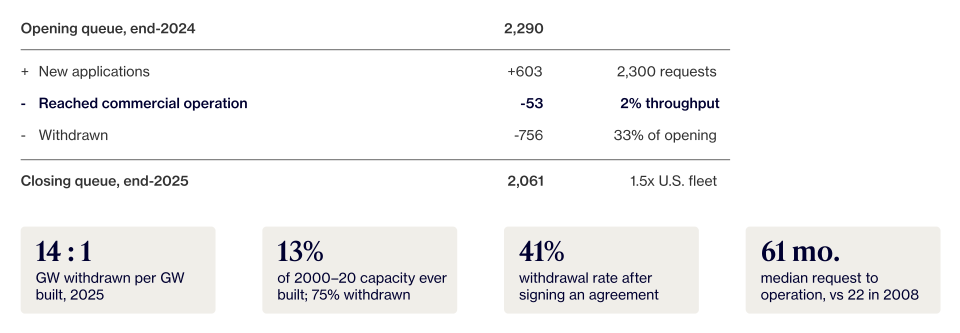
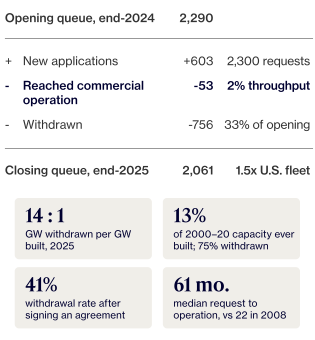
Note: This includes a net change of -23GW that were suspended during the year. Source: Lawrence Berkeley National Lab as of 10/15/2026. Past performance is not a guarantee of future results. Not intended as a recommendation to buy or sell any securities named herein. For illustrative purposes only. Not a projection of future results.
New chip demand in the US from NVDA + AMD + AVGO needs ~20GW in 2027: Taking NVDA’s 2027 data center revenue estimate of $670B and implying a 75% unit mix of Vera Rubin, we get to ~$37B per GW of chip revenue opportunity for NVDA, a blend of the $25B per GW Jensen disclosed for Blackwell and $40B for Vera Rubin, weighted by power draw rather than units since Rubin GPU draws ~1.5x a Blackwell. That implies ~18GW of power globally must be available to energize everything NVDA sells in 2027, or ~12.6GW in the US assuming ~70% lands domestically.
SPCX increases our US supply additions estimate to 20-35GW (from 15-25GW): Based on our estimate that SpaceX delivers 5-10GW in 2027, we update our US 2027 new supply estimate to 20-35GW from 15-25GW prior. On that basis, NVDA alone would require ~63% of all new US capacity at the low end, but only ~36% at the high end. Adding AMD (~3-4GW) and Broadcom (~4GW), the 3 together need ~20GW of US capacity in 2027, ~100% of additions at the low end of our range, falling to ~57% at the high end.
What 2027 Chip Sales Need, Against What the US Will Build
| From revenue to gigawatts | |
| NVDA CY27 data center revenue | $670B |
| ÷ blended revenue per GW (75% Vera Rubin mix) | $37B |
| = global power required | ~18 GW |
| × ~70% US share | ~12.6 GW |
| + AMD (~3–4GW) and Broadcom (~4GW) | ~20 GW |
Share of new US capacity absorbed
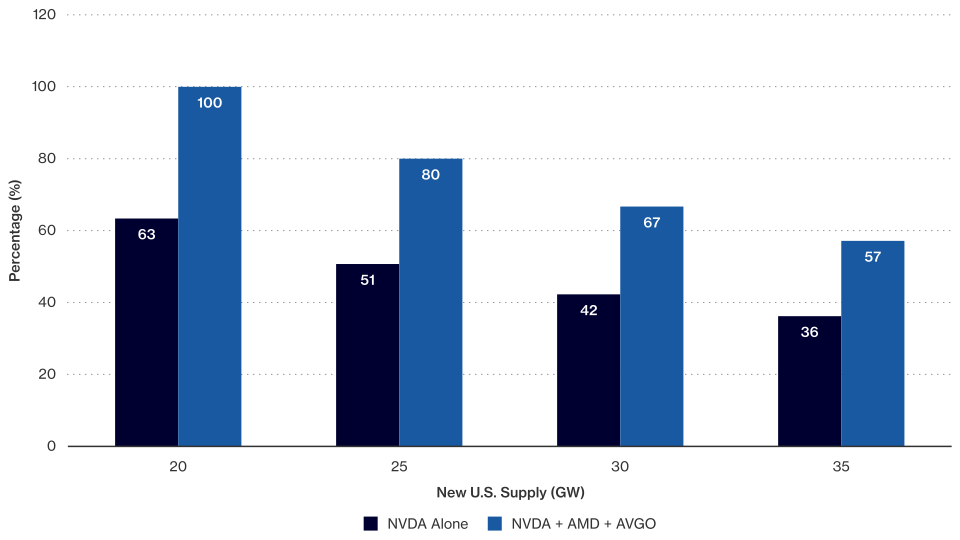
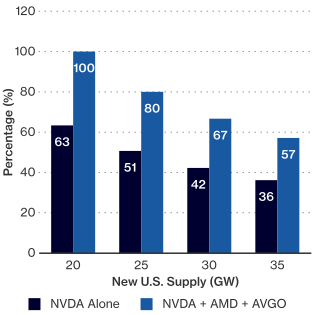
Source: VanEck estimates as of 10/30/2026. Past performance is not a guarantee of future results. Not intended as a recommendation to buy or sell any securities named herein. For illustrative purposes only. Not a projection of future results.
Estimated US Power Needed for AI Accelerators, CY26-27 (GW)
| Company | CY2026 | CY2027 low | CY2027 high | Total (mid) |
| NVDA (70% of global) | 8 | 11 | 11 | 19.0 |
| AMD (Meta + OpenAI) | 1 | 3 | 4 | 4.5 |
| AVGO XPU (80% of global) | 2 | 4 | 4 | 6.0 |
| Combined | 11 | 18 | 19 | 29.5 |
Source: VanEck estimates as of 10/30/2026. Past performance is not a guarantee of future results. Not intended as a recommendation to buy or sell any securities named herein. For illustrative purposes only. Not a projection of future results.
Each 1GW of NVDA-bound capacity that doesn’t get energized puts ~5.5% of 2027 revenue estimates at risk: We estimate ~$37B of revenue per GW, or ~5.5% of the $670B data center revenue estimate. At ~75% incremental gross margin, each GW is worth ~$0.95 of EPS, or ~6% of consensus 2027 EPS ($15.90).
- At NVDA’s current ~13x P/E, each GW short implies ~$12 per share, or ~6% downside to the stock if the multiple holds. If new US supply is 30GW and NVDA, AMD and AVGO capture 60% of it, NVDA is ~1.3GW short. That implies ~7.5% downside at the current multiple, and up to ~28% if the multiple compresses to 10x. In short: if US additions come in around 30GW and the three chipmakers collectively capture 60%, NVIDIA falls ~1.3GW short of what it needs for 2027, which could lead to a ~6-12% cut in 2027 EPS.
NVDA Power Shortfall Sensitivity: Impact to 2027 Estimates and Stock Price
| NVDA GW short | Revenue at risk (%) | EPS cut (%) | Stock at 14x | Stock at 12.9x (multiple holds) | Stock at 10x |
| 0 | 0 | 0 | $223 (+9%) | $205 (0%) | $159 (-22%) |
| 1 | -5.5 | -6 | +2% | -6% | -27% |
| 2 | -11 | -12 | -4% | -12% | -32% |
| 3 | -17 | -18 | -11% | -18% | -36% |
| 4 | -22 | -24 | -17% | -24% | -41% |
| 5 | -28 | -30 | -24% | -30% | -45% |
| 6 | -33 | -36 | -30% | -36% | -50% |
| 8 | -44 | -48 | -43% | -48% | -59% |
Source: VanEck estimates, Yahoo Finance, 24/7 Wall St. (consensus EPS) as of 10/30/2026. Past performance is not a guarantee of future results. Not intended as a recommendation to buy or sell any securities named herein. For illustrative purposes only. Not a projection of future results.
If demand and supply both favor PSPs, the real debate is about cost of capital. Below we stress-test the three variables that matter most: build costs, interest rates and the funding needed for the next wave of leases.
Recommended subscription
Sensitivities: Costs, Rates and Funding
Higher Prices Are Real, but Tenants Are Absorbing Them
Capex inflation on the next tranche of builds is a real risk, raising both upfront funding needs and the pricing required to maintain returns. That said, our conversations suggest that tenants understand the cost pressure and are willing to accept higher rents, evidenced by higher pricing on the most recent deals. Further, land, power and shell costs are far less per MW than the GPUs tenants must buy, so inflation here remains a smaller factor in their economics than GPU inflation.
- We see that to maintain a mid-to-high-teens yield, deals need to price >$220M annually per 100 megawatts (MW) ($2.2M per MW) if costs were to rise to $14-15M per MW (from the $10-12M today). We see this as achievable, considering the recent deals in the space that have priced around $2.4M per MW. We expect hyperscaler deals to increasingly rise >$2M per MW, while their IG backing supports lower funding costs to remain a solid spread.
- August AI lab deals between Bitdeer (BTDR) and Riot Platforms (RIOT) priced at ~$2.4M per MW, while July IG deals for TeraWulf (WULF), CleanSpark (CLSK) and Hut 8 (HUT) have priced in the $1.8-1.9M range. Given the supply scarcity, we see potential for these to move up even more than the expected rising costs to build.
- We also believe including caps on the construction costs (with excess covered by tenant) will become increasingly prevalent in order to protect against potential changes or overruns that the powered shell providers may face.
Required Annual Rent per MW by Build Cost and Yield
| Build cost per MW | 12% | 14% | 16% | 18% | 20% |
| $10M | $1.20M | $1.40M | $1.60M | $1.80M | $2.00M |
| $11M | $1.32M | $1.54M | $1.76M | $1.98M | $2.20M |
| $12M | $1.44M | $1.68M | $1.92M | $2.16M | $2.40M |
| $13M | $1.56M | $1.82M | $2.08M | $2.34M | $2.60M |
| $14M | $1.68M | $1.96M | $2.24M | $2.52M | $2.80M |
| $15M | $1.80M | $2.10M | $2.40M | $2.70M | $3.00M |
Source :VanEck estimates as of 10/30/26. Past performance is not a guarantee of future results. Not intended as a recommendation to buy or sell any securities named herein. For illustrative purposes only. Not a projection of future results.
Interest rate sensitivity to funding costs, refinancing and valuation: A key risk to powered shell providers is the uncertainty around the trajectory of interest rates in the US amid higher oil prices, geopolitical uncertainty and questions around the ROI on AI investments/capex across the economy. Key sensitivities for these names are (1) the ability to fund buildouts, both raising capital at all and doing so at rates that support strong returns; (2) the potential to pull equity out of existing debt through refinancings when construction notes first become callable in 2027-2028; and (3) the impact of discount rates on the valuations of long-term contracted cash flows.
Tenor and DSCR terms drive PSP funding value: We estimate the higher-rate environment has less impact on PSP funding needs than the terms of new issuance, specifically tenor and debt service coverage ratios (DSCR). For names like BTDR raising project-level debt to fund the remainder of its Tydal build for its Volta lease, a 10-16 year tenor (vs 5-6) or looser covenants (DSCR <1.5x) could unlock significantly more equity value on capital already spent. The nominal rate drives interest expense, but we see a long-dated note creating far more value than a 25-100bps rate move.
We see a long-dated note creating far more value than a 25-100bps rate move.
Recent Deals Show the Credit Market Remains Open, Although Increasingly Selective
Several financings completed in late October suggest that debt markets remain open to AI infrastructure, although lenders are pricing each deal according to the credit quality behind it. Volta’s ~$5B loan for its Tydal lease and an Anthropic GPU contract priced at a borrowing cost of ~11%,after the banks underwrote only the $1.3B lease-related tranche and left the $3.7B GPU tranche to clear on a best-efforts basis. SpaceX secured ~$40B of GPU financing, which Elon Musk attributed to its investment-grade status and revenue from Starlink and launch, while banks completed a $63B financing for Anthropic’s lease of 1.5GW of Google’s tensor processing units (TPUs) only after Broadcom agreed to higher rates and guaranteed $42B. Smaller deals also got done, with IREN closing a $363M refinancing secured by GPUs already deployed and generating revenue and HIVE Digital (HIVE) securing a $129M 3-year loan at a fixed 9.0% rate, covering about 80% of the cost of its GPU cluster. These deals support our view that tenor, structure and tenant credit quality will drive value more than moves in the base rate, and they reinforce why lenders price long-term leases with investment-grade tenants very differently from shorter-term GPU financings. In the event that Anthropic secures a non-IG rating ahead of its initial public offering (IPO), it could add a wrinkle to financing for many of these names, which is another reason we expect to see more focus on investment-grade hyperscale deals.
Refinancing Risk: The Equity Pull-Out Is Likely Deferred
Rising rates pose a key risk to the ~$23B of debt that first becomes callable in 2027-2028. At current rates, we expect refinancing to slip to 2029-2030, which would push equity extraction on these initial construction loans out to the same timeframe. As a result, near-term growth may depend on additional equity raises and dilution.
- With the 5-year treasury at ~4% on average when these deals priced (vs ~5% now), a ~100bps higher base rate largely absorbs the spread tightening we expect as construction and execution risk fall. Stabilized spreads of ~165-300bps on a ~5% base imply refinancing coupons of ~6.7-8%, in line with the ~7.9% weighted average today, resulting in relatively flat coupons and little savings to offset call premiums.
Construction Bonds First Callable in 2027-2028 Total ~$23.4B
| First call | Company | Bond | Size ($B) | Closed | Yield at issue | 5-yr UST at pricing | Spread (yield) | Maturity | Tenant |
| Oct 15, 2027 | WULF | WULF Compute (Lake Mariner) | $3.20 | Oct 23, 2025 | 7.750% | 3.59% | 416bp | Oct-31 | Fluidstack (Google-backed) + Core42 |
| Nov 15, 2027 | CIFR | Cipher Compute (Barber Lake) | $1.73 | Nov 13, 2025 | 7.120% | 3.71% | 341bp | Nov-30 | Fluidstack / Google support |
| Dec 15, 2027 | APLD | Polaris Forge 1 | $2.35 | Nov 20, 2025 | 10.000% | 3.71% | 629bp | Dec-30 | CoreWeave |
| Dec 31, 2027 | WULF | Flash Compute (Abernathy JV) | $1.30 | Dec 29, 2025 | 7.250% | 3.70% | 355bp | Dec-30 | Fluidstack |
| Feb 15, 2028 | CIFR | Black Pearl Compute | $2.00 | Feb 11, 2026 | 6.125% | 3.80% | 233bp | Feb-31 | AWS |
| Mar 15, 2028 | APLD | Polaris Forge 2 | $2.15 | Mar 10, 2026 | 7.200% | 3.67% | 353bp | Mar-31 | Investment-grade hyperscaler |
| May 15, 2028 | CORZ | Core Scientific Finance I | $3.30 | May 6, 2026 | 7.933% | 3.94% | 399bp | May-31 | CoreWeave |
| Jun 15, 2028 | APLD | ELN-04 | $1.59 | Jun 16, 2026 | 7.000% | 4.17% | 283bp | Jun-31 | CoreWeave |
| Aug 1, 2028 | GLXY | Helios II | $3.51 | Jul 28, 2026 | 10.000% | 4.46% | 554bp | Aug-31 | CoreWeave |
| Oct 1, 2028 | CLSK | CSDC Finance I (Sandersville) | $2.28 | Sep 25, 2026 | 8.200% | 4.85% | 335bp | Oct-31 | Meta |
| Total callable / weighted avg. | $23.4 | 8.1% | 4.0% | 408bp | |||||
| Hard maturity | GLXY | Helios I term loan | $1.4 | Aug 15, 2025 | SOFR + 4.75% (2.5% floor) | Floating | Aug-28 | CoreWeave | |
| Total incl. Helios I | $24.8 |
Sources: Company 8-Ks and indentures (dates, coupons, issue prices, call dates). 5-yr UST: weekly averages Oct 2025–Mar 2026, Jun 2026 daily, Sep 18 2026 close; CORZ implied from reported +399bp. Yields on discounted issues approximated to maturity. Past performance is not a guarantee of future results. Not intended as a recommendation to buy or sell any securities named herein.
Calling at the First Call Date to Save Coupon: Spread Needed at a 5% Base, After Call Premium and Fees
| Bond | Coupon | First call price | Price confirmed? | Call premium (%) | Premium + fees (%) | Annual hurdle | Coupon spread over base | Spread to match | Plausible spread low | Plausible spread high | Verdict at first call |
| GLXY Helios II (CoreWeave) | 9.875% | 104.938% | No (est.) | 4.937 | 6.187 | 206bp | 488bp | 281bp | 250bp | 300bp | Borderline yes; clears if spread lands at ~280bp or tighter |
| APLD Polaris Forge 1 (CoreWeave) | 9.250% | 104.625% | Yes | 4.625 | 5.875 | 196bp | 425bp | 229bp | 250bp | 300bp | No; close, needs spread below plausible range |
| CLSK Sandersville (Meta) | 7.875% | 103.938% | Yes | 3.938 | 5.188 | 173bp | 288bp | 115bp | 165bp | 200bp | No |
| WULF Lake Mariner (Fluidstack/Google + Core42) | 7.750% | 103.875% | Yes | 3.875 | 5.125 | 171bp | 275bp | 104bp | 175bp | 225bp | No |
| CORZ (CoreWeave) | 7.750% | 103.875% | Yes | 3.875 | 5.125 | 171bp | 275bp | 104bp | 250bp | 300bp | No |
| WULF Flash Compute | 7.250% | 103.625% | Yes | 3.625 | 4.875 | 163bp | 225bp | 63bp | 175bp | 225bp | No |
| CIFR Barber Lake | 7.125% | 103.563% | Yes | 3.563 | 4.813 | 160bp | 213bp | 52bp | 175bp | 225bp | No |
| APLD ELN-04 (CoreWeave) | 7.000% | 103.500% | Yes | 3.500 | 4.750 | 158bp | 200bp | 42bp | 250bp | 300bp | No |
| APLD Polaris Forge 2 (investment-grade tenant) | 6.750% | 103.375% | Yes | 3.375 | 4.625 | 154bp | 175bp | 21bp | 165bp | 200bp | No |
| CIFR Black Pearl (AWS) | 6.125% | 103.063% | Yes | 3.063 | 4.313 | 144bp | 113bp | (31bp) | 165bp | 200bp | No |
| GLXY Helios I (floating) | SOFR + 475bp (~9.1% at issue) | n/a (matures Aug 2028) | n/a, must refinance | 250bp | 300bp | Required; fixed at ~7.5–8.0% likely lowers the rate |
Source: Company indentures, VanEck analysis as of 10/30/26. Past performance is not a guarantee of future results. Not intended as a recommendation to buy or sell any securities named herein. For illustrative purposes only. Not a projection of future results.
With Refinancing Pushed to 2029-2030, the Next Wave of Leases May Need ~$0.6-3.2B of New Equity
- Signed projects are funded; the next tranche is not: A delayed refinancing cycle does not create an equity need for projects already signed, as we believe following the recent Cipher Mining (CIFR) convert all the signed leases today have sufficient equity to build through cash, converts, preferred equity or high LTC project debt.
- Refinancing doesn’t fill the void until 2029-2030: That said, funding the next tranche of leases will likely require more equity than these companies currently have. Assuming $11-13M per MW (our baseline for 2028-2029 power, a premium to recent deals at ~$9-12M) and 10-25% equity contributions (in-line with prior deals), the next unsigned tranche needs ~$5.7-9.1B of equity, against ~$7.2-8.4B of uncommitted liquidity, implying ~$0.6-3.2B of potential raises in 2027-2028 if leasing continues at the targeted pace. The gap is concentrated in companies further ahead in their buildouts (WULF, Core Scientific (CORZ)) and those with large upcoming sites (RIOT, Galaxy Digital (GLXY)). With little equity released at the 2027-2028 first call dates, that gap is more likely funded by converts or stock rather than by refinancing proceeds until 2029-2030.
Potential offsets include:
- Higher loan-to-cost project debt: CIFR recently funded 98% of Stingray’s cost with debt.
- Sales of stabilized assets or stakes: WULF sold its 50.1% Abernathy interest for ~$530M, a ~20% IRR on its investment.
- Rising lease rates: Applied Digital (APLD) expects ~250MW of expansion leases by year end at rates more than 15% higher than its prior leases. Higher rent per MW lifts NOI and debt capacity, reducing the equity share of each new build.
Liquidity After Signed Builds
| Company | Starting liquidity | Source / date | Signed builds still to fund | Equity needed for signed builds | Basis | Remaining liquidity |
| CORZ | $1.82B | Cash + digital assets | AMD ~530 MW (from early 2027) | $1.20B | 530 MW × $11M × 20% | $0.62B |
| WULF | $2.00B | Parent liquidity incl. ~$0.53B Abernathy sale proceeds (est.) | Justified (Anthropic) ~401 MW | $1.00B | ~$10-11M/MW × ~20-25% | $1.00B |
| CIFR | $0.87B | Unrestricted cash + BTC | Barber Lake, Black Pearl, Stingray | - | Project debt ~98% of cost | $0.87B |
| CLSK | $0.92B | ~$0.2B cash + ~14k BTC | Sandersville (Meta) 175 MW | - | Equity already funded | $0.92B |
| GLXY | $1.00B | Data center equity capital (est.) | Helios Phases II and III | $0.20B | Phase II funded; Phase III equity pre-funded | $0.80B |
| APLD | $2.90B | Cash | Polaris Forge 3, Delta Forge 1 and 2 (~810 MW) | $1.90B | Common share after Macquarie preferred | $1.00B |
| RIOT | $1.20B | Total liquidity (cash + BTC) | Rockdale AI lab 191 MW + AMD 50 MW | $0.40B | 191 MW × $11-12M × 15-20% | $0.80B |
| HUT | $1.30B | Parent cash + revolver | Beacon Point Phase 2 (352 MW; financing in progress) | $0.70B | ~$4.4B × ~5-15%, IG structure | $0.60B |
| KEEL | $0.82B | ~$0.70B cash + ~$0.12B BTC | None signed (pre-lease development) | $0.20B | Pre-lease development spend | $0.62B |
| IREN | $14.00B | Cash ($7.6B) + committed GPU financing and prepayments | FY27 capex $25-30B | $8.00B | Ex-GPU financing + prepayments | $6.00B |
Source: Company Q2/Q3 2026 releases and earnings calls, VanEck estimates as of 10/30/26. Past performance is not a guarantee of future results. Not intended as a recommendation to buy or sell any securities named herein.
Equity Need for the Next Unsigned Tranche
| Company | Next likely tranche | MW (IT) | $/MW (assumed) | Capex | Equity share | Equity need | Remaining liquidity | Potential gap |
| CORZ | AMD options or new sites, late 2028+ | 500 | $11–13M | ~$5.5–6.5B | ~20% | ~$1.1–1.3B | ~$0.6B | ~$0.5–0.7B |
| WULF | Muskie Phase 1, 2H28 | 400 | $11–13M | ~$4.4–5.2B | ~20–25% | ~$0.9–1.3B | ~$1.0-1.1B | ~$0–0.3B |
| CIFR | Reveille, Ulysses, Odessa | 350 | $14M | ~$4.9B | ~10% | ~$0.5B | ~$0.87B | ~$0 |
| CLSK | Texas exclusivity (Sealy and Brazoria), first phase | 400 | $11–13M | ~$4.4–5.2B | ~10% | ~$0.4–0.5B | ~$0.9B | ~$0 (relies on BTC) |
| GLXY | Remaining ~830 MW gross approved at Helios | 550 | $11–13M | ~$6.1–7.2B | ~15–20% | ~$0.9–1.4B | ~$0.8B | ~$0.1–0.6B |
| APLD | ~250 MW expansion leases at existing campuses | 250 | $11–13M | ~$2.8–3.3B | ~10–15% (ex-Macquarie) | ~$0.3–0.5B | ~$1.0-1.5B | ~$0 |
| RIOT | Corsicana LOI (phased) | 756 | $11–13M | ~$8.3–9.8B | ~10–20% | ~$0.8–2.0B | ~$0.8B | ~$0–1.2B |
| HUT | River Bend expansion (Fluidstack ROFO) or exclusivity sites | 400 | $11–13M | ~$4.4–5.2B | ~5–15% (IG structure) | ~$0.2–0.8B | ~$0.6-1.1B | ~$0–0.2B |
| KEEL | Panther Creek, Sharon, Moses Lake (in lease negotiations) | 250 | $11–13M | ~$2.8–3.3B | ~20–25% | ~$0.6–0.8B | ~$0.6-0.7B | ~$0–0.2B |
| Total (excl. IREN) | 3,850 | ~$44–50B | ~$5.7–9.1B | ~$7.2-8.4B | ~$0.6–3.2B | |||
| IREN | FY27 contracted deployments + additional | 500 | $60M | ~$25–30 | ex-GPU financing/prepayments | ~$1–6B | Included in funding | ~$1–6B |
| Total incl. IREN | 4,350 | ~$68–80B | ~$6.7–15.1B | ~$1.6–9.2B |
Note: Potential gap is calculated company by company, so surplus liquidity at one miner is not netted against another's shortfall. Source: Company filings, VanEck estimates as of 10/30/26. Past performance is not a guarantee of future results. Not intended as a recommendation to buy or sell any securities named herein. For illustrative purposes only. Not a projection of future results.
With the funding picture framed, we turn to what the signed leases are actually worth.
Valuation: Energized Power Priced Below Replacement Cost
- The market is valuing contracted power that will be energized over the coming quarters at less than it costs to build. We believe that gap is the clearest sign of how negative sentiment has become. While equity dilution and financing tied to future growth cloud the near-term outlook, we see an opportunity for these names to pull back on future growth plans at any point and still realize significant value above where they trade today.
- Replacement cost: some powered sites are valued at a fraction of what it costs to build the shell.
- Cap rates: valuing first full-year net operating income (NOI) the way a real estate buyer would implies values well above today’s prices.
- Multiples: on 2028 estimates the group trades at ~50% the EV/EBITDA of data center REITs.
The market is valuing contracted power that will be energized over the coming quarters at less than it costs to build.
Cap Rates Point to Deep Undervaluation
The simplest way to value these leases is as stabilized real estate assets. Once current builds are complete, they become long-term, contracted, REIT-like cash flows, especially if a company stops funding new growth. We estimate NOI for each name in the first full year after all of its signed leases are operational, then value it across a 5-10% cap rate range. For reference, Digital Realty paid a cap rate >6.5% for leased hyperscale buildings in June. If public prices fall too far below that range, the gap becomes an M&A opportunity. Data center REITs and infrastructure funds could buy the contracted cash flows at an attractive return, which could help put a floor under valuations.
Implied Asset Value and Equity Upside From First Full-Year NOI
| Company | NOI | Mkt cap | Net debt | Unfunded capex | Implied value / equity upside at cap rate 5% | Implied value / equity upside at cap rate 6% | Implied value / equity upside at cap rate 7% | Implied value / equity upside at cap rate 8% | Implied value / equity upside at cap rate 9% | Implied value / equity upside at cap rate 10% |
| CIFR 2028 | 727 | 3,317 | 4,781 | 0 | $14.5B +194% | $12.1B +121% | $10.4B +69% | $9.1B +30% | $8.1B −1% | $7.3B −25% |
| HUT 2029 | 1,450 | 7,321 | 7,747 | 3,800 | $29.0B +138% | $24.2B +72% | $20.7B +25% | $18.1B −10% | $16.1B −38% | $14.5B −60% |
| WULF 2029 | 1,250 | 5,853 | 2,618 | 3,900 | $25.0B +216% | $20.8B +145% | $17.9B +94% | $15.6B +56% | $13.9B +26% | $12.5B +2% |
| CORZ 2029 | 1,400 | 4,258 | 4,449 | 6,100 | $28.0B +310% | $23.3B +200% | $20.0B +122% | $17.5B +63% | $15.6B +18% | $14.0B −19% |
| APLD 2029 | 1,800 | 5,387 | 5,743 | 11,500 | $36.0B +248% | $30.0B +137% | $25.7B +57% | $22.5B −2% | $20.0B −49% | $18.0B −86% |
Source: Company filings, VanEck estimates as of 10/30/2026. Past performance is not a guarantee of future results. Not intended as a recommendation to buy or sell any securities named herein. For illustrative purposes only. Not a projection of future results.
Multiples Vary Across the Group as Each Is at Different Stages of Its Buildout
- On 2028 estimates (when the majority of currently leased capacity is fully contributing), the powered shell provider group trades at ~9x EV/EBITDA, a significant discount to the ~18.5x for Equinix (EQIX)/DLR. While this discount is justified in the stage of the buildout, each delivery milestone represents a step closer to reaching NOI on long-term contracts with investment-grade tenants, which support cash flows to fund expansions and growth at rates that exceed DC REITs. In such a scenario (post-build risk), arguments can be made that these multiples should converge.
Powered Shell Providers: 2028 EV/EBITDA Versus Data Center REITs
| Ticker | Company | Market Cap ($M) | EV ($M) | 2026E EBITDA ($M) | 2027E EBITDA ($M) | 2028E EBITDA ($M) | EV/EBITDA 2026E | EV/EBITDA 2027E | EV/EBITDA 2028E |
| MARA US Equity | Marathon Digital Holdings | 2,615 | 4,742 | (1,002) | 399 | 221 | NM | 11.9x | 21.5x |
| CLSK US Equity | CleanSpark | 1,970 | 3,554 | 11 | 164 | 357 | 323.2x | 21.7x | 10.0x |
| RIOT US Equity | Riot Platforms | 4,807 | 5,213 | (327) | 113 | 372 | NM | 46.0x | 14.0x |
| HIVE US Equity | HIVE Digital Technologies | 528 | 665 | 59 | 182 | 397 | 11.2x | 3.7x | 1.7x |
| BTDR US Equity | Bitdeer Technologies | 1,824 | 2,828 | 155 | 614 | 949 | 18.3x | 4.6x | 3.0x |
| KEEL US Equity | Keel Infrastructure | 1,242 | 1,352 | (92) | (83) | 122 | NM | NM | 11.1x |
| IREN US Equity | Iris Energy | 9,690 | 11,634 | 443 | 3,673 | 7,955 | 26.2x | 3.2x | 1.5x |
| WULF US Equity | TeraWulf | 5,853 | 8,471 | 49 | 508 | 1,114 | 173.8x | 16.7x | 7.6x |
| CIFR US Equity | Cipher Digital | 3,026 | 7,806 | (258) | 610 | 834 | NM | 12.8x | 9.4x |
| HUT US Equity | Hut 8 Corp | 7,270 | 15,017 | (241) | 335 | 1,022 | NM | 44.8x | 14.7x |
| CORZ US Equity | Core Scientific | 4,258 | 8,707 | 229 | 642 | 1,118 | 38.1x | 13.6x | 7.8x |
| APLD US Equity | Applied Digital | 5,387 | 11,130 | 171 | 692 | 1,474 | 64.9x | 16.1x | 7.5x |
| WYFI US Equity | Whitefiber | 469 | 732 | 43 | 156 | 232 | 17.2x | 4.7x | 3.2x |
| NBIS US Equity | Nebius | 44,339 | 46,354 | 1,425 | 6,868 | 15,625 | 32.5x | 6.7x | 3.0x |
| CRWV US Equity | Coreweave | 30,263 | 76,332 | 7,533 | 16,757 | 28,048 | 10.1x | 4.6x | 2.7x |
| IREN US Equity | Iren | 9,690 | 11,634 | 443 | 3,673 | 7,955 | 26.2x | 3.2x | 1.5x |
| Median | 11.9x | 7.6x | |||||||
| Mean | 14.3x | 7.5x | |||||||
| Data Center REITs / Infrastructure | |||||||||
| Ticker | Company | Market Cap ($M) | EV ($M) | 2026E EBITDA ($M) | 2027E EBITDA ($M) | 2028E EBITDA ($M) | EV/EBITDA 2026E | EV/EBITDA 2027E | EV/EBITDA 2028E |
| EQIX US Equity | Equinix | 100,344 | 123,174 | 5,309 | 5,952 | 6,703 | 23.2x | 20.7x | 18.4x |
| DLR US Equity | Digital Realty | 69,574 | 91,810 | 3,830 | 4,357 | 4,975 | 24.0x | 21.1x | 18.5x |
Source: Bloomberg, VanEck as of 10/30/2026. Past performance is not a guarantee of future results. Not intended as a recommendation to buy or sell any securities named herein. For illustrative purposes only. Not a projection of future results.
A REIT Lens on Valuation
Public data center REITs trade at nearly 20x next-twelve-month (NTM) adjusted funds from operations (AFFO). The AFFO equivalent for CIFR is site NOI less interest on the debt (excludes principal amortization). Applying 20x to 2027 AFFO on these 3 leases implies ~$9B of equity value. For WULF, with leases that don’t stabilize until 2029, 20x on 2029 AFFO implies ~$15.9B in equity value (or $13B discounted to today at 10%). HUT’s current leases don’t fully contribute until 2029-2030, but a 20x AFFO multiple implies $17.3B in equity value (or $12-13B discounted at 10% to today, still well above the market cap today). We use this as an acquisition view of the 3 leases, not the company as a whole. It excludes corporate G&A, which would be minimal under a REIT or infrastructure owner, and assumes converts are settled as part of a transaction. That said, REITs carry less leverage and grow AFFO 10-12% a year, vs ~3% escalators for CIFR, WULF and HUT. As such, we’d expect these assets to trade more in the 12-15x range, which implies 62-103% upside for CIFR ($5.4-6.7B), 63-103% for WULF ($9.5-11.9B) and 42-77% for HUT ($10.4-13B).
CIFR: Property-Level AFFO and Value of the 3 Leases
$mm unless noted · as if REIT-owned, Cipher’s current debt · mkt cap $3,317m (10/30 close) · ~455m shares ($7.29) · completed EV $8.7bn
| 2027 | 2028 | 2029 | 2030 | 2031 | 2032 | 2033 | 2034 | 2035 | 2036 | |
| Site NOI | 686 | 727 | 749 | 771 | 794 | 818 | 843 | 868 | 894 | 921 |
| Interest, net of interest income | (237) | (255) | (235) | (210) | (245) | (308) | (282) | (253) | (223) | (191) |
| Property-level AFFO | 449 | 472 | 514 | 561 | 549 | 510 | 561 | 615 | 671 | 730 |
| PER SHARE & YIELDS | ||||||||||
| AFFO per share ($) | 0.99 | 1.04 | 1.13 | 1.23 | 1.21 | 1.12 | 1.23 | 1.35 | 1.47 | 1.60 |
| AFFO yield on mkt cap | 13.5% | 14.2% | 15.5% | 16.9% | 16.6% | 15.4% | 16.9% | 18.5% | 20.2% | 22.0% |
| Price / AFFO | 7.4x | 7.0x | 6.5x | 5.9x | 6.0x | 6.5x | 5.9x | 5.4x | 4.9x | 4.5x |
| Unlevered NOI yield on completed EV | 7.8% | 8.3% | 8.6% | 8.8% | 9.1% | 9.3% | 9.6% | 9.9% | 10.2% | 10.5% |
CIFR: What the Three Leases Are Worth
Multiples on 2027 AFFO ($449m) · cap rates on 2028 NOI ($727m) less $5.4bn net debt + capex left
| Method | Equity value | Per share | Upside |
| 20x AFFO (data center REIT multiple) | $9.0bn | $19.74 | +171% |
| 15x AFFO (lower growth, higher leverage) | $6.7bn | $14.80 | +103% |
| 12x AFFO | $5.4bn | $11.84 | +62% |
| 6.0–6.5% cap rate on stabilized NOI | $5.8–6.7bn | $12.71–14.76 | +73–102% |
| 7.0% cap rate (BXDC upper end) | $5.0bn | $10.96 | +49% |
| Today (~7.4x 2027 AFFO) | $3.3bn | $7.29 | – |
Source: Company filings, VanEck estimates as of 10/30/2026. Past performance is not a guarantee of future results. Not intended as a recommendation to buy or sell any securities named herein.
WULF: Property-Level AFFO and Value of the 3 Leases
$mm unless noted · as if REIT-owned, TeraWulf’s current debt · mkt cap $5,853m (10/30 close) · 499m shares ($11.73) · completed EV $13.5bn · 2027–28 (italic) = ramp years
| 2027 | 2028 | 2029 | 2030 | 2031 | 2032 | 2033 | 2034 | 2035 | 2036 | |
| Site NOI | 467 | 1,094 | 1,250 | 1,288 | 1,326 | 1,366 | 1,406 | 1,449 | 1,466 | 1,260 |
| Interest, net of interest income | (351) | (455) | (457) | (418) | (375) | (389) | (415) | (341) | (292) | (242) |
| Property-level AFFO | 116 | 639 | 793 | 870 | 951 | 977 | 991 | 1,108 | 1,174 | 1,018 |
| PER SHARE & YIELDS | ||||||||||
| AFFO per share ($) | 0.23 | 1.28 | 1.59 | 1.74 | 1.91 | 1.96 | 1.99 | 2.22 | 2.35 | 2.04 |
| AFFO yield on mkt cap | 2.0% | 10.9% | 13.5% | 14.9% | 16.2% | 16.7% | 16.9% | 18.9% | 20.1% | 17.4% |
| Price / AFFO | n/m | 9.2x | 7.4x | 6.7x | 6.2x | 6.0x | 5.9x | 5.3x | 5.0x | 5.7x |
| Unlevered NOI yield on completed EV | 3.5% | 8.1% | 9.3% | 9.6% | 9.9% | 10.1% | 10.4% | 10.8% | 10.9% | 9.4% |
WULF: What the Three Leases Are Worth
Multiples on 2029 AFFO ($793m) · cap rates on 2029 NOI ($1,250m) less $7.6bn net debt + capex left
| Method | Equity value | Per share | Upside |
| 20x AFFO (data center REIT multiple) | $15.9bn | $31.78 | +171% |
| 15x AFFO (lower growth, higher leverage) | $11.9bn | $23.84 | +103% |
| 12x AFFO | $9.5bn | $19.07 | +63% |
| 6.0–6.5% cap rate on stabilized NOI | $11.6–13.2bn | $23.29–26.50 | +99–126% |
| 7.0% cap rate (BXDC upper end) | $10.2bn | $20.54 | +75% |
| Today (~7.4x 2029 AFFO) | $5.9bn | $11.73 | – |
Source: Company filings, VanEck estimates as of 10/30/2026. Past performance is not a guarantee of future results. Not intended as a recommendation to buy or sell any securities named herein.
HUT: Property-Level AFFO and Value of the 3 Leases
$mm unless noted · three signed leases, Hut 8’s project bonds · price $59.40 (10/30 close) · 123.3m shares · mkt cap $7.3bn · completed EV $18.5bn · 2027–28 (italic) = ramp years
| 2027 | 2028 | 2029 | 2030 | 2031 | 2032 | 2033 | 2034 | 2035 | 2036 | |
| Site NOI | 147 | 815 | 1,392 | 1,546 | 1,592 | 1,640 | 1,689 | 1,740 | 1,792 | 1,846 |
| Interest, net of interest income | (457) | (613) | (670) | (681) | (657) | (619) | (578) | (535) | (489) | (440) |
| Property-level AFFO | (311) | 202 | 723 | 866 | 935 | 1,021 | 1,111 | 1,205 | 1,304 | 1,406 |
| PER SHARE & YIELDS | ||||||||||
| AFFO per share ($) | (2.52) | 1.64 | 5.87 | 7.02 | 7.59 | 8.29 | 9.02 | 9.78 | 10.58 | 11.41 |
| AFFO yield on mkt cap | n/m | 2.8% | 9.9% | 11.8% | 12.8% | 13.9% | 15.2% | 16.5% | 17.8% | 19.2% |
| Price / AFFO | n/m | 36.2x | 10.1x | 8.5x | 7.8x | 7.2x | 6.6x | 6.1x | 5.6x | 5.2x |
| Unlevered NOI yield on completed EV | 0.8% | 4.4% | 7.5% | 8.4% | 8.6% | 8.9% | 9.1% | 9.4% | 9.7% | 10.0% |
HUT: What the Three Leases Are Worth
Multiples on 2030 AFFO ($866m) · cap rates on 2030 NOI ($1,546m) less $11.2bn net debt + capex left (incl. ~$4.25bn Beacon Point Ph.2, not yet financed)
| Method | Equity value | Per share | Upside |
| 20x AFFO (data center REIT multiple) | $17.3bn | $140.43 | +136% |
| 15x AFFO (lower growth, higher leverage) | $13.0bn | $105.33 | +77% |
| 12x AFFO | $10.4bn | $84.26 | +42% |
| 6.0–6.5% cap rate on stabilized NOI | $12.6–14.6bn | $102.38–118.46 | +72–99% |
| 7.0% cap rate (BXDC upper end) | $10.9bn | $88.59 | +49% |
| Today (~8.5x 2030 AFFO) | $7.3bn | $59.40 | – |
Source: Company filings, VanEck estimates as of 10/30/2026. Past performance is not a guarantee of future results. Not intended as a recommendation to buy or sell any securities named herein.
Key Risks and Our View
This space is not without risk, but most of these risks can be managed. Close attention to tenant quality, funding and power timelines lets investors steer towards the names best placed to weather them.
| Risk | Why it is credible | Our view |
| Tenant credit | Neocloud debt is repricing; CoreWeave debt near 15% | Real, but concentrated. Most of the group's leases are with investment-grade tenants or carry a hyperscaler backstop. The exposure sits mainly with CoreWeave's landlords, and higher lease pricing helps compensate. |
| Equity dilution | Each new lease needs equity alongside project debt, and higher rates may limit debt capacity | Front-loaded, not permanent. Equity needs peak during construction. Once leases are cash-flowing, refinancing into longer-dated debt should fund growth with far less dilution. Names with current builds already funded face the least risk. |
| Power-date slips | NextDC's stock down ~40% on grid delays, while Nscale lost MSFT contract on grid timelines | An argument for the group, not against it. The market punishes missed dates because energized power is scarce. Sites with interconnection already granted hold that advantage. |
| Policy and NIMBY | Pauses in TX, NY, PA cover a significant portion of the pipeline; midterms on 11/3 | A headwind for new supply, a tailwind for incumbents. Pauses and audits slow would-be competitors far more than they affect sites already energized. |
| Pipeline credibility | Consensus sees significant amount of potential capacity unlikely to actually be built | Fair for the sector, already priced for our names. The market assigns little or no value to pipelines today; signed leases alone support current valuations. |
| Residual value | Re-leasing uncertainty after year 15–20; innovation or technology changes | Small for today's valuation. Project debt is largely paid down by year 15–20, and we see historically low data center vacancy rates as reason to believe there is value post lease. |
Source: Vaneck analysis as of 10/30/26. Past performance is not a guarantee of future results. Not intended as a recommendation to buy or sell any securities named herein.
Assessing Data Center Risk After a Texas Surprise
While the markets were pricing in a Democratic takeover of both the House and the Senate to some extent, we believe the magnitude of the win was unexpected. Most notably, a new Democratic Governor in Texas was not our base case, we think this introduces new questions and greater uncertainty for many PSPs operating in that region. We believe states with available power and comparatively lower near-term political risk, such as North Dakota, Louisiana and Kentucky, could stand to benefit from a potential moratorium on Texas data centers.
All Eyes on Texas: Texas holds ~30% of data center capacity currently under construction nationally, and Governor-elect Hinojosa has floated a broad moratorium on new sites until new legislation can be put in place. With the scope, mechanism and timeline all undefined, we expect greater uncertainty to continue to drive a risk-off reaction to many Texas based operators. Governor Abbott currently has two months left in office and retains the ability to push project approvals through before handoff, a dynamic that could favor operators who are already energized or sit at the front of ERCOT's interconnection queue.
Key Questions in Texas
- Scope and mechanism of a moratorium: Does the moratorium cover only new applications or also projects under construction or with an interconnect agreement in hand?
- PUCT Control: With two seats expiring in September 2027, could Hinojosa's appointments change the trajectory of ERCOT into 2028?
- Fate of the ERCOT Process: Will ERCOT's interconnection process continue as planned?
- Energization dates: Is a reasonable base case that the mega projects with energization dates in 1H27 proceed as planned?
- Grandfathering of executed agreements: For sites planned in 2H27 and beyond, is a signed PPA or interconnection agreement protected from retroactive review or do those publicly committed project timelines still hold if tenants are already secured (such as HUT's Beacon Point Phase 2 project with a signed tenant)?
- Sales-tax repeal bill: With the bill already advancing in the Senate under GOP control, will the trajectory change under a Democratic governor?
Texas Policy Exposure
| Ticker | Texas Exposure | Non-TX Exposure | Our Take |
| CIFR | Colchis, Stingray, Apollo, Mikeeska, McLennan, Black Pearl, Barber Lake | Low | Highest risk with entire pipeline in TX and largely pre-construction |
| HUT | Beacon Point (Phase 1 and 2) | High with less than 5% of greenfield pipeline is in ERCOT | Beacon Point Phase 2 requires approvals from the current audit process |
| GLXY | Helios and newly acquired sites | Low | Helios Phase 1 is operating and contracted, but Helios 2 and the newly acquired sites are earlier-stage and more exposed |
| CLSK | Sealy, Brazoria | Medium: Sandersville (GA) | Both TX sites face local-level uncertainty (county moratorium fight) layered on top of any state-level action |
| CORZ | Denton, Pecos, Austin, Hunt County site | High: Dalton (GA), Marble (NC), Muskogee (OK), plus others | Meaningful TX growth plans at risk, but strong non-TX diversification cushions the platform overall |
| MARA | Granbury, Garden City, Matagorda | Medium: Hannibal/Long Ridge (OH), Kearney (NE) | Ohio anchor site limits downside even if TX growth slows, but similar uncertainties exist in OH |
| IREN | Sweetwater (Phase 1 and 2) | Medium: Spain, Australia | International footprint offsets flagship TX concentration |
| RIOT | Rockdale, Corsicana | Low | Lowest risk despite being the most TX-concentrated name with both campuses are already energized, approved, and leased |
Source: VanEck Analysis as of 11/3/26. Past performance is not a guarantee of future results. Not intended as a recommendation to buy or sell any securities named herein.
Conclusion
While October’s decline reflected concerns about rising interest rates and tighter credit, it did not reflect any deterioration in the underlying businesses of powered shell providers. Signed leases remain in place, hyperscaler investment continues to grow, and chips are being produced faster than the grid can supply the power needed to run them. With new capacity increasingly contested, delayed and politically exposed, we believe bitcoin miners hold one of the most valuable positions in the AI buildout through their control of energized, approved grid capacity. The early access to power, long-term contracts with investment-grade tenants and clear paths to expansion set them apart from the shorter-term neoclouds the market has treated as their equivalent.
- Bitcoin mining provides a further advantage that the market has largely overlooked. While many of these companies have abandoned their mining growth ambitions, the diminishing business still generates cash flow from sites awaiting AI conversion, reducing the need for equity raises and shareholder dilution as credit conditions tighten. The ability to move miners to a site also puts grid capacity to immediate use, making these companies more attractive customers to utilities and power generators when new capacity is allocated.
- At current levels, we believe the group trades below the replacement cost of its contracted power. The PSP companies trade at roughly half the 2028 EV/EBITDA multiple of data center REITs and well below what cap-rate and AFFO frameworks imply once current leases stabilize. While the risks remain real, including the potential to fund the next tranche of growth with additional equity and political uncertainty around the midterms and data center “not in my backyard” (NIMBY) opposition, if these companies were to pause expansion today the leases already signed support values meaningfully above current prices, and REIT and infrastructure buyers could put a floor on valuations. We view the October de-rating as a dislocation driven by macro conditions and sentiment rather than a broken thesis, and an opportunity for investors willing to look through near-term rate volatility.
Frequently Asked Questions
What are powered shell providers, and how do they differ from neoclouds?
Powered shell providers (PSPs) include many bitcoin miners that have pivoted to leasing energized, grid-connected sites to AI tenants, who install their own computing equipment. PSPs sign 10-20 year leases often backed by investment-grade tenants, while CoreWeave’s average contract runs ~2-5 years. Many PSPs also mine bitcoin, which lets them earn on pipeline land before AI sites are ready.
Why did powered shell provider stocks fall in October?
PSPs fell an average of ~35% in October as concerns about their ability to raise debt, a hotter-than-expected September consumer price index that revived rate-hike expectations, and regulatory uncertainty ahead of the November 3 midterms weighed on the group. No signed leases across the public companies we cover were cancelled. We see the move as a de-rating driven by funding costs rather than a deterioration in demand.
Why is power the binding constraint on AI data center growth?
Little of the headline power pipeline can be built on a useful timeline. In 2025, only 53GW of the ~2,290GW US interconnection queue reached commercial operation (~2%), and the median project now takes 61 months from request to operation, up from 22 months in 2008. Morgan Stanley projects a 38GW US data center shortfall through 2028, which we believe raises the value of energized power.


Important Disclosures
Statements regarding market cycles are the author’s opinion as of this date and are not a prediction of future performance. Past performance is no guarantee of future results.
Definitions
Bitcoin (BTC) is the world’s largest cryptocurrency by market capitalization.
Powered shell providers (PSPs) are companies, many of them bitcoin miners that have pivoted to AI, that lease energized, grid-connected data center sites to tenants, who install their own computing equipment.
Neoclouds are cloud providers that rent GPU computing capacity to AI developers and companies; CoreWeave is an example.
Adjusted funds from operations (AFFO) is a cash-flow measure used for real estate investment trusts. In this piece, the AFFO equivalent for a powered shell provider is site net operating income less interest on debt, excluding principal amortization.
Basis Point (bps) is one one-hundredth of one percent (0.01%); 100 basis points equal 1%.
Hyperscalers are the largest cloud computing companies, such as Amazon Web Services, Microsoft Azure and Google Cloud, that operate massive global data center networks and are among the biggest buyers of AI chips and data center capacity.
Graphics processing unit (GPU) is a specialized chip originally designed for rendering graphics that is now the primary hardware used to train and run AI models. NVIDIA's H100, B200 and Vera Rubin are examples.
Megawatt (MW) and gigawatt (GW) are units of electrical power. One gigawatt equals 1,000 megawatts. Data center capacity is typically described by the amount of power a site can deliver to computing equipment.
Energized power refers to electrical capacity that is connected to the grid and available for use today, as opposed to capacity that has been requested or approved but not yet delivered.
Interconnection queue is the backlog of projects waiting for approval and physical connection to the electrical grid. Projects can sit in the queue for years before receiving power, and many are withdrawn before completion.
Capital expenditures (capex) are funds a company spends to build or acquire long-lived physical assets, such as data centers, power infrastructure or computing hardware.
Net operating income (NOI) is the income a property generates from rent after operating expenses, but before interest, taxes and depreciation. It is a standard measure of property-level cash flow in real estate.
Cap rate (capitalization rate) is a property's net operating income divided by its value. Real estate investors use cap rates to compare returns across properties; a lower cap rate implies a higher valuation for the same income.
Enterprise value to EBITDA (EV/EBITDA) is a valuation multiple that compares a company's total value (equity plus debt, less cash) to its earnings before interest, taxes, depreciation and amortization. It is commonly used to compare companies with different levels of debt.
Price-to-earnings ratio (P/E) is a company's share price divided by its earnings per share, and is a common measure of how much investors are paying for each dollar of earnings.
Real estate investment trust (REIT) is a company that owns income-producing real estate and distributes most of its income to shareholders. Data center REITs such as Equinix and Digital Realty own and lease data center properties.
Investment grade (IG) refers to a credit rating of BBB-/Baa3 or higher, indicating a relatively low risk of default. Leases backed by investment-grade tenants are generally viewed as lower risk and can be financed at lower rates.
Debt service coverage ratio (DSCR) is a measure of a borrower's ability to pay its debt, calculated as cash flow available for debt service divided by required principal and interest payments. Lenders often set minimum DSCR levels as loan covenants.
Loan-to-cost (LTC) is the amount of a construction loan as a percentage of a project's total cost. A higher LTC means less equity is required from the developer.
Tenor is the length of time until a loan or bond matures.
Call date is the first date on which a borrower is allowed to repay a bond or loan early, typically to refinance it at better terms.
Refinancing is replacing an existing loan or bond with a new one, usually to lower the interest rate, extend the maturity or release equity from an asset.
Convertible note (convert) is a bond that can be exchanged for a set number of shares of the issuer's stock, allowing companies to borrow at lower interest rates in exchange for potential equity dilution.
Credit default swap (CDS) is a financial contract that insures against a borrower defaulting on its debt. A wider CDS spread indicates the market sees a higher risk of default.
Spread is the difference between the yield on a bond or loan and the yield on a comparable US Treasury security, and reflects the additional return investors demand for taking on credit risk.
Hash rate is the total computational power used to mine and process transactions on the Bitcoin network.
Digital asset treasury company (DAT) is a publicly traded company whose primary strategy is to accumulate and hold digital assets such as bitcoin on its balance sheet.
Electric Reliability Council of Texas (ERCOT) is the operator of the electrical grid that serves most of Texas. Its Batch Zero process refers to its review of large-load interconnection requests, including data centers.
Commodity Futures Trading Commission (CFTC) is the US federal agency that regulates derivatives markets, including futures and options.
Consumer price index (CPI) is a measure of the average change in prices paid by consumers for goods and services, and is the most widely followed gauge of US inflation.
Daily active users (DAUs) is the number of unique users who engage with an app or service in a given day, a common measure of consumer adoption.
Initial public offering (IPO) is the first sale of a company's shares to the public on a stock exchange.
De-rating is a decline in the valuation multiple investors are willing to pay for a stock or sector, independent of any change in the underlying earnings or cash flows.
Tranche is a portion or slice of a larger financing or project. In this piece, the "next tranche" of leases refers to the next round of sites to be signed and built.
Lease escalator is the contractual annual increase in rent under a lease, typically a fixed percentage such as 2-3% per year.
Replacement cost is what it would cost today to build an equivalent asset from scratch. When a company trades below replacement cost, the market values its existing assets at less than it would cost to recreate them.
Next-twelve-month (NTM) refers to a financial estimate covering the coming 12 months, commonly used as the basis for forward valuation multiples.
Silicon Data H100 Neo-Cloud Rental Price Index (SDH100RT) is a daily benchmark of the standardized hourly rental price of NVIDIA H100 GPUs quoted by neo-cloud providers, expressed in US dollars per GPU-hour. The index is published by Silicon Data and is available on Bloomberg.
Silicon Data B200 Rental Price Index (SDB200RT) is a daily benchmark of the standardized hourly rental price of NVIDIA Blackwell B200 GPUs quoted by neo-cloud providers, expressed in US dollars per GPU-hour. The index is published by Silicon Data and is available on Bloomberg.
Disclosures
This is not an offer to buy or sell, or a recommendation to buy or sell any of the securities, financial instruments or digital assets mentioned herein. The information presented does not involve the rendering of personalized investment, financial, legal, tax advice, or any call to action. Certain statements contained herein may constitute projections, forecasts and other forward-looking statements, which do not reflect actual results, are for illustrative purposes only, are valid as of the date of this communication, and are subject to change without notice. Actual future performance of any assets or industries mentioned are unknown. Information provided by third party sources are believed to be reliable and have not been independently verified for accuracy or completeness and cannot be guaranteed. VanEck does not guarantee the accuracy of third party data. The information herein represents the opinion of the author(s), but not necessarily those of VanEck or its other employees.
The information, valuation scenarios and price targets presented on any digital assets in this blog are not intended as financial advice, a recommendation to buy or sell these digital assets, or any call to action. There may be risks or other factors not accounted for in these scenarios that may impede the performance of these digital assets; their actual future performance is unknown, and may differ significantly from any valuation scenarios or projections/forecasts herein. Any projections, forecasts or forward-looking statements included herein are the results of a simulation based on our research, are valid as of the date of this communication and subject to change without notice, and are for illustrative purposes only. Please conduct your own research and draw your own conclusions.
Past performance is not an indication, or guarantee, of future results. Hypothetical or model performance results have certain inherent limitations. Unlike an actual performance record, simulated results do not represent actual trading, and accordingly, may have undercompensated or overcompensated for the impact, if any, of certain market factors such as market disruptions and lack of liquidity. In addition, hypothetical trading does not involve financial risk and no hypothetical trading record can completely account for the impact of financial risk in actual trading (for example, the ability to adhere to a particular trading program in spite of trading losses). Hypothetical or model performance is designed with benefit of hindsight.
Index performance is not representative of fund performance. It is not possible to invest directly in an index.
Investments in digital assets and Web3 companies are highly speculative and involve a high degree of risk. These risks include, but are not limited to: the technology is new and many of its uses may be untested; intense competition; slow adoption rates and the potential for product obsolescence; volatility and limited liquidity, including but not limited to, inability to liquidate a position; loss or destruction of key(s) to access accounts or the blockchain; reliance on digital wallets; reliance on unregulated markets and exchanges; reliance on the internet; cybersecurity risks; and the lack of regulation and the potential for new laws and regulation that may be difficult to predict. Moreover, the extent to which Web3 companies or digital assets utilize blockchain technology may vary, and it is possible that even widespread adoption of blockchain technology may not result in a material increase in the value of such companies or digital assets.
Digital asset prices are highly volatile, and the value of digital assets, and Web3 companies, can rise or fall dramatically and quickly. If their value goes down, there’s no guarantee that it will rise again. As a result, there is a significant risk of loss of your entire principal investment.
Digital assets are not generally backed or supported by any government or central bank and are not covered by FDIC or SIPC insurance. Accounts at digital asset custodians and exchanges are not protected by SPIC and are not FDIC insured. Furthermore, markets and exchanges for digital assets are not regulated with the same controls or customer protections available in traditional equity, option, futures, or foreign exchange investing.
Digital assets include, but are not limited to, cryptocurrencies, tokens, NFTs, assets stored or created using blockchain technology, and other Web3 products.
Web3 companies include but are not limited to, companies that involve the development, innovation, and/or utilization of blockchain, digital assets, or crypto technologies.
All investing is subject to risk, including the possible loss of the money you invest. As with any investment strategy, there is no guarantee that investment objectives will be met and investors may lose money. Diversification does not ensure a profit or protect against a loss in a declining market. Past performance is no guarantee of future performance.
© Van Eck Associates Corporation
Important Disclosures
Statements regarding market cycles are the author’s opinion as of this date and are not a prediction of future performance. Past performance is no guarantee of future results.
Definitions
Bitcoin (BTC) is the world’s largest cryptocurrency by market capitalization.
Powered shell providers (PSPs) are companies, many of them bitcoin miners that have pivoted to AI, that lease energized, grid-connected data center sites to tenants, who install their own computing equipment.
Neoclouds are cloud providers that rent GPU computing capacity to AI developers and companies; CoreWeave is an example.
Adjusted funds from operations (AFFO) is a cash-flow measure used for real estate investment trusts. In this piece, the AFFO equivalent for a powered shell provider is site net operating income less interest on debt, excluding principal amortization.
Basis Point (bps) is one one-hundredth of one percent (0.01%); 100 basis points equal 1%.
Hyperscalers are the largest cloud computing companies, such as Amazon Web Services, Microsoft Azure and Google Cloud, that operate massive global data center networks and are among the biggest buyers of AI chips and data center capacity.
Graphics processing unit (GPU) is a specialized chip originally designed for rendering graphics that is now the primary hardware used to train and run AI models. NVIDIA's H100, B200 and Vera Rubin are examples.
Megawatt (MW) and gigawatt (GW) are units of electrical power. One gigawatt equals 1,000 megawatts. Data center capacity is typically described by the amount of power a site can deliver to computing equipment.
Energized power refers to electrical capacity that is connected to the grid and available for use today, as opposed to capacity that has been requested or approved but not yet delivered.
Interconnection queue is the backlog of projects waiting for approval and physical connection to the electrical grid. Projects can sit in the queue for years before receiving power, and many are withdrawn before completion.
Capital expenditures (capex) are funds a company spends to build or acquire long-lived physical assets, such as data centers, power infrastructure or computing hardware.
Net operating income (NOI) is the income a property generates from rent after operating expenses, but before interest, taxes and depreciation. It is a standard measure of property-level cash flow in real estate.
Cap rate (capitalization rate) is a property's net operating income divided by its value. Real estate investors use cap rates to compare returns across properties; a lower cap rate implies a higher valuation for the same income.
Enterprise value to EBITDA (EV/EBITDA) is a valuation multiple that compares a company's total value (equity plus debt, less cash) to its earnings before interest, taxes, depreciation and amortization. It is commonly used to compare companies with different levels of debt.
Price-to-earnings ratio (P/E) is a company's share price divided by its earnings per share, and is a common measure of how much investors are paying for each dollar of earnings.
Real estate investment trust (REIT) is a company that owns income-producing real estate and distributes most of its income to shareholders. Data center REITs such as Equinix and Digital Realty own and lease data center properties.
Investment grade (IG) refers to a credit rating of BBB-/Baa3 or higher, indicating a relatively low risk of default. Leases backed by investment-grade tenants are generally viewed as lower risk and can be financed at lower rates.
Debt service coverage ratio (DSCR) is a measure of a borrower's ability to pay its debt, calculated as cash flow available for debt service divided by required principal and interest payments. Lenders often set minimum DSCR levels as loan covenants.
Loan-to-cost (LTC) is the amount of a construction loan as a percentage of a project's total cost. A higher LTC means less equity is required from the developer.
Tenor is the length of time until a loan or bond matures.
Call date is the first date on which a borrower is allowed to repay a bond or loan early, typically to refinance it at better terms.
Refinancing is replacing an existing loan or bond with a new one, usually to lower the interest rate, extend the maturity or release equity from an asset.
Convertible note (convert) is a bond that can be exchanged for a set number of shares of the issuer's stock, allowing companies to borrow at lower interest rates in exchange for potential equity dilution.
Credit default swap (CDS) is a financial contract that insures against a borrower defaulting on its debt. A wider CDS spread indicates the market sees a higher risk of default.
Spread is the difference between the yield on a bond or loan and the yield on a comparable US Treasury security, and reflects the additional return investors demand for taking on credit risk.
Hash rate is the total computational power used to mine and process transactions on the Bitcoin network.
Digital asset treasury company (DAT) is a publicly traded company whose primary strategy is to accumulate and hold digital assets such as bitcoin on its balance sheet.
Electric Reliability Council of Texas (ERCOT) is the operator of the electrical grid that serves most of Texas. Its Batch Zero process refers to its review of large-load interconnection requests, including data centers.
Commodity Futures Trading Commission (CFTC) is the US federal agency that regulates derivatives markets, including futures and options.
Consumer price index (CPI) is a measure of the average change in prices paid by consumers for goods and services, and is the most widely followed gauge of US inflation.
Daily active users (DAUs) is the number of unique users who engage with an app or service in a given day, a common measure of consumer adoption.
Initial public offering (IPO) is the first sale of a company's shares to the public on a stock exchange.
De-rating is a decline in the valuation multiple investors are willing to pay for a stock or sector, independent of any change in the underlying earnings or cash flows.
Tranche is a portion or slice of a larger financing or project. In this piece, the "next tranche" of leases refers to the next round of sites to be signed and built.
Lease escalator is the contractual annual increase in rent under a lease, typically a fixed percentage such as 2-3% per year.
Replacement cost is what it would cost today to build an equivalent asset from scratch. When a company trades below replacement cost, the market values its existing assets at less than it would cost to recreate them.
Next-twelve-month (NTM) refers to a financial estimate covering the coming 12 months, commonly used as the basis for forward valuation multiples.
Silicon Data H100 Neo-Cloud Rental Price Index (SDH100RT) is a daily benchmark of the standardized hourly rental price of NVIDIA H100 GPUs quoted by neo-cloud providers, expressed in US dollars per GPU-hour. The index is published by Silicon Data and is available on Bloomberg.
Silicon Data B200 Rental Price Index (SDB200RT) is a daily benchmark of the standardized hourly rental price of NVIDIA Blackwell B200 GPUs quoted by neo-cloud providers, expressed in US dollars per GPU-hour. The index is published by Silicon Data and is available on Bloomberg.
Disclosures
This is not an offer to buy or sell, or a recommendation to buy or sell any of the securities, financial instruments or digital assets mentioned herein. The information presented does not involve the rendering of personalized investment, financial, legal, tax advice, or any call to action. Certain statements contained herein may constitute projections, forecasts and other forward-looking statements, which do not reflect actual results, are for illustrative purposes only, are valid as of the date of this communication, and are subject to change without notice. Actual future performance of any assets or industries mentioned are unknown. Information provided by third party sources are believed to be reliable and have not been independently verified for accuracy or completeness and cannot be guaranteed. VanEck does not guarantee the accuracy of third party data. The information herein represents the opinion of the author(s), but not necessarily those of VanEck or its other employees.
The information, valuation scenarios and price targets presented on any digital assets in this blog are not intended as financial advice, a recommendation to buy or sell these digital assets, or any call to action. There may be risks or other factors not accounted for in these scenarios that may impede the performance of these digital assets; their actual future performance is unknown, and may differ significantly from any valuation scenarios or projections/forecasts herein. Any projections, forecasts or forward-looking statements included herein are the results of a simulation based on our research, are valid as of the date of this communication and subject to change without notice, and are for illustrative purposes only. Please conduct your own research and draw your own conclusions.
Past performance is not an indication, or guarantee, of future results. Hypothetical or model performance results have certain inherent limitations. Unlike an actual performance record, simulated results do not represent actual trading, and accordingly, may have undercompensated or overcompensated for the impact, if any, of certain market factors such as market disruptions and lack of liquidity. In addition, hypothetical trading does not involve financial risk and no hypothetical trading record can completely account for the impact of financial risk in actual trading (for example, the ability to adhere to a particular trading program in spite of trading losses). Hypothetical or model performance is designed with benefit of hindsight.
Index performance is not representative of fund performance. It is not possible to invest directly in an index.
Investments in digital assets and Web3 companies are highly speculative and involve a high degree of risk. These risks include, but are not limited to: the technology is new and many of its uses may be untested; intense competition; slow adoption rates and the potential for product obsolescence; volatility and limited liquidity, including but not limited to, inability to liquidate a position; loss or destruction of key(s) to access accounts or the blockchain; reliance on digital wallets; reliance on unregulated markets and exchanges; reliance on the internet; cybersecurity risks; and the lack of regulation and the potential for new laws and regulation that may be difficult to predict. Moreover, the extent to which Web3 companies or digital assets utilize blockchain technology may vary, and it is possible that even widespread adoption of blockchain technology may not result in a material increase in the value of such companies or digital assets.
Digital asset prices are highly volatile, and the value of digital assets, and Web3 companies, can rise or fall dramatically and quickly. If their value goes down, there’s no guarantee that it will rise again. As a result, there is a significant risk of loss of your entire principal investment.
Digital assets are not generally backed or supported by any government or central bank and are not covered by FDIC or SIPC insurance. Accounts at digital asset custodians and exchanges are not protected by SPIC and are not FDIC insured. Furthermore, markets and exchanges for digital assets are not regulated with the same controls or customer protections available in traditional equity, option, futures, or foreign exchange investing.
Digital assets include, but are not limited to, cryptocurrencies, tokens, NFTs, assets stored or created using blockchain technology, and other Web3 products.
Web3 companies include but are not limited to, companies that involve the development, innovation, and/or utilization of blockchain, digital assets, or crypto technologies.
All investing is subject to risk, including the possible loss of the money you invest. As with any investment strategy, there is no guarantee that investment objectives will be met and investors may lose money. Diversification does not ensure a profit or protect against a loss in a declining market. Past performance is no guarantee of future performance.
© Van Eck Associates Corporation