The Case for Real Assets: Historically Inexpensive vs. Stocks
September 25, 2026
Read Time 10+ MIN
Key Takeaways
- Commodities trade near their lowest price relative to U.S. stocks since 1970, a gap driven by 15 years of equity outperformance.
- Real assets delivered their strongest returns when inflation ran above 6%, but were also competitive in the 2 to 6% range that covers most of modern history.
- Commodity cycles have played out over decades, not quarters, and the current drawdown is long by historical standards.
The first article in this series asked how investors ended up owning so little of the physical economy. The answer was three decades of flows into stocks and bonds, allocations that never cleared 2%, and index fund makeup that helped reduce real asset exposure over the years.
Under-ownership alone is not a reason to buy anything. In this article, we ask if there is a case for owning real assets today beyond the fact that few people do?
Commodities Remain Cheap Relative to Stocks
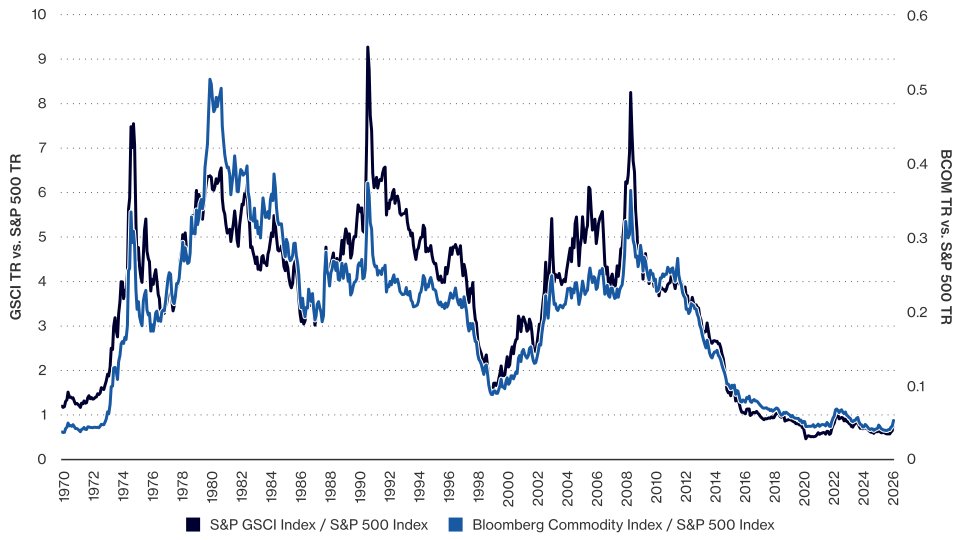
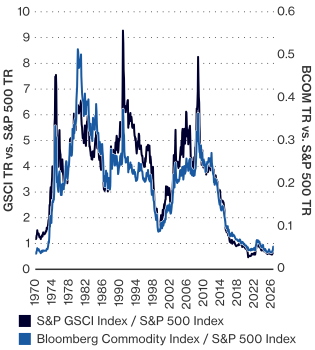
Measured against the S&P 500, both the S&P GSCI and the Bloomberg Commodity Index sit close to their lowest levels since 1970. The GSCI ratio is below where it started the series more than half a century ago.
Total Return Price Ratio – Commodities vs. U.S. Stocks
Source: VanEck, Bloomberg Data as of June 2026. Past performance not indicative of future results. Index descriptions included at the end of this article.
Every previous time this ratio reached comparable extremes, including the late 1990s and the early 1970s, a period of commodity outperformance followed. That is a small sample, roughly three turns in five decades, and it is not a forecast. But relative price extremes have historically been where supply discipline, capital starvation, and eventual mean reversion begin.
Commodities Have Thrived in Inflationary Environments
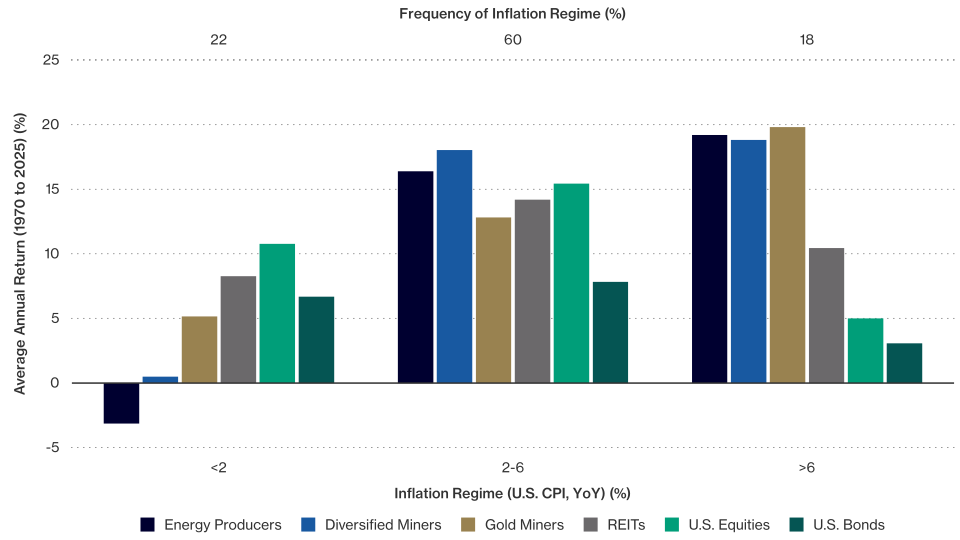
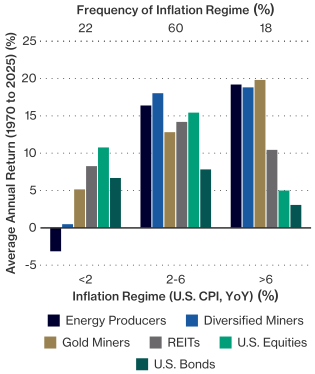
Sorting returns from 1970 to 2025 by U.S. inflation we are able to determine a few patterns. When inflation ran above 6%, energy producers, diversified miners, and gold miners all returned roughly 19% to 20% annually, while U.S. equities returned about 5% and bonds about 3%. That regime occurred only 18% of the time over this 55 year time horizon.
Average Annual Return of Global Resources in Varying Inflation Regimes – 1970 to 2025
Average Annual Return of Commodities in Varying Inflation Regimes – 1970 to 2025
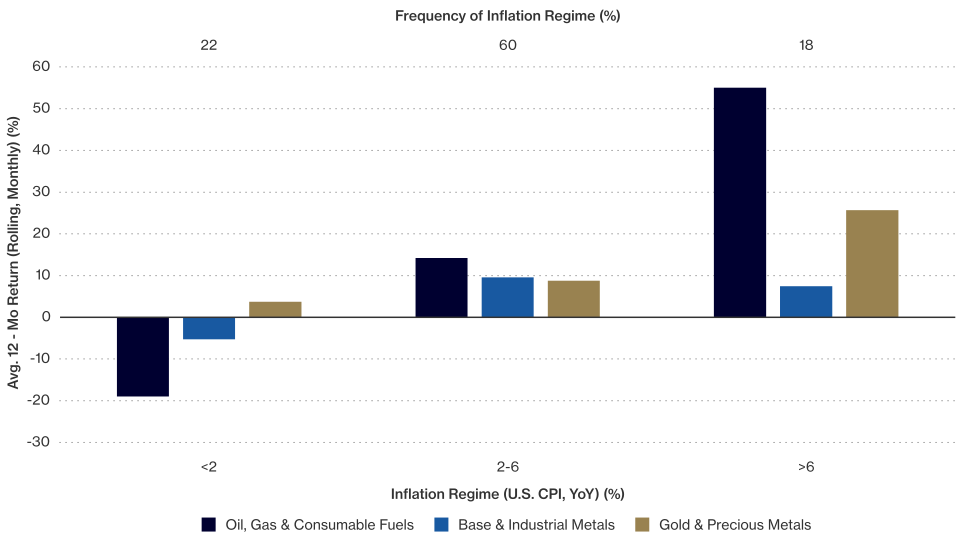
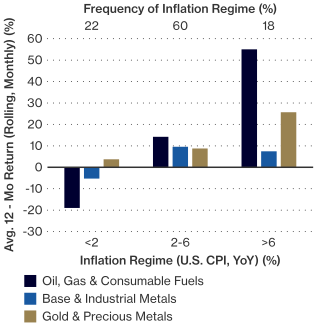
Index returns are not Fund returns and are not illustrative of a fund's performance. You cannot invest directly in an index.
Source: VanEck, Bloomberg, CRSP, FactSet. “Base & Industrial Metals” represented by World Bank Commodity Price Data - Metals & Minerals Index. “Diversified Miners” = MSCI ACWI Select Metals & Mining Producers ex. Gold & Silver Index from Sep-2001 to present, EMIX Global Mining ex. Gold & Energy Index from Jan-1986 to Aug-2001, and CRSP - 48 Industry Portfolios (Mines, Average Value Weighted) returns from Jan-1970 to Dec-1985. “Energy Producers” = MSCI ACWI Select Energy Producers Index from Sep-2001 to present, EMIX Global Energy Index from Jan-1986 to Aug-2001, and CRSP - 10 Industry Portfolios (Energy, Average Value Weighted) returns from Jan-1970 to Dec-1985. “Gold & Precious Metals” represented by World Bank Commodity Price Data - Precious Metals Index. “Gold Miners” = NYSE Arca Gold Miners Index from Oct-1993 to present and CRSP’s - 48 Industry Portfolios (Gold, Average Value Weighted) returns from Jan-1970 to Sep-1993. “Oil, Gas & Consumable Fuels” represented by World Bank Commodity Price Data - Energy Index. “REITs” = FTSE NAREIT All Equity REITs Index (note: index inception is Jan-1972). “U.S. Bonds” = Bloomberg U.S. Aggregate Bond Index from Jan-1976 to present, Bloomberg U.S. Aggregate Government/Credit Index from Jan-1973 to Dec-1976 and a blend of Ibbotson's SBBI U.S. 1 Year Treasury Index, U.S. Intermediate-Term Government Bond Index, U.S. Long-Term Government Bond Index, and U.S. Long-Term Corporate Bond Index series from Jan 1970 to Dec-1971. “U.S. Stocks” = S&P 500 Index. Past performance not indicative of future results. Index descriptions included at the end of this article.
In the 2 to 6% regime that covers roughly 60% of the period, diversified miners and energy producers were broadly competitive with U.S. equities rather than a drag. Real assets in that band behaved like a return source with a different driver, not merely a hedge waiting for a shock.
Recommended subscription
Commodity Cycles Have Often Lasted Decades
Commodity price history stretching back to 1800 shows long secular swings. Bear markets have run 10 to 20 years. So have the rallies between them.
Commodity Composite Price Value (Indexed at 100)
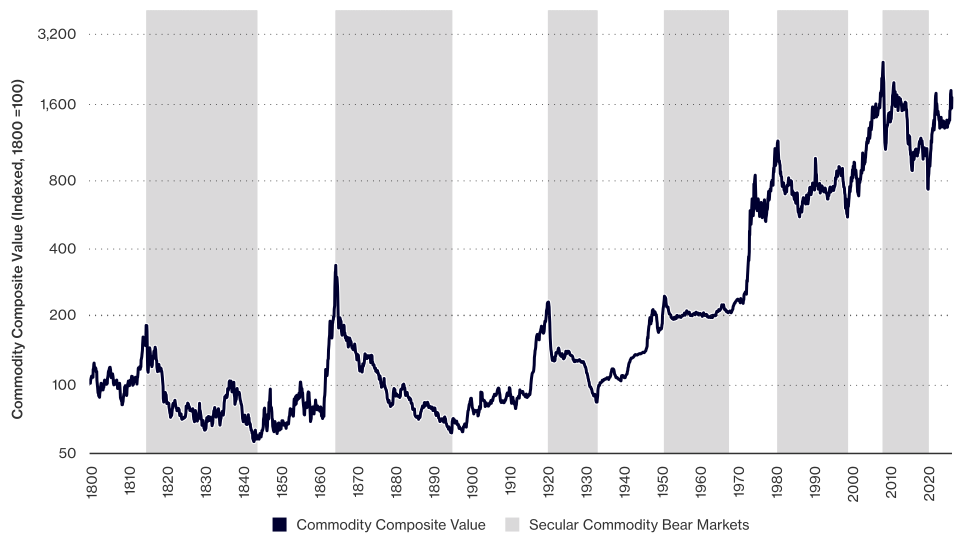
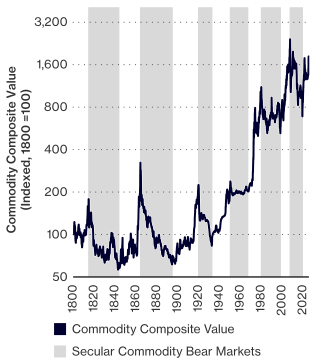
Source: VanEck, Bloomberg Data as of March 2026. Past performance not indicative of future results. Index descriptions included at the end of this article.
As the chart shows, commodity regimes turn slowly, which suggests positioning decisions in this asset class are measured in years, and that waiting for confirmation has historically meant missing a meaningful portion of the move.
What This Means for Portfolios
Real assets are priced at a multi-decade discount to U.S. equities, they carry a return profile that improves as inflation rises, and they sit in the long tail of a cycle that historically turns on a decade-plus clock.
For a portfolio that currently holds close to 1% in commodities, the question is less about conviction on the next 12 months and more about whether the current allocation reflects any view at all.
VanEck Natural Resources and Commodities Solutions
VanEck has a history of investing in natural resources and commodities for over 50 years, offering investors actively and passively managed strategies, from physical commodities to natural resource equities. We offer specialized exposure to individual sectors and diversified solutions with broad exposure across sectors and industries.
| Symbol | Name | Agriculture / Agri-Food Technology |
Gold/ Precious Metals |
Base/ Industrial Metals |
Strategic/ Rare Earth Metals |
Renewable/ Alternative Energy |
Traditional Energy (Oil & Gas) |
Energy MLPs |
Infrastructure | REITs |
| GHAAX/ GHAIX | Global Resources Fund | ■ | ■ | ■ | ■ | ■ | ■ | |||
| CMCAX/ COMIX | CM Commodity Index Fund | ■ | ■ | ■ | ■ | |||||
| CMCI | CMCI Commodity Strategy ETF | ■ | ■ | ■ | ■ | |||||
| INIVX/ INIIX | International Investors Gold Fund | ■ | ||||||||
| CRAK | Oil Refiners ETF | ■ | ||||||||
| EINC | Energy Income ETF | ■ | ■ | |||||||
| GDX | Gold Miners ETF | ■ | ||||||||
| GDXJ | Junior Gold Miners ETF | ■ | ||||||||
| EMET | Copper and Electrification ETF | ■ | ■ | ■ | ||||||
| HAP | Natural Resources ETF | ■ | ■ | ■ | ■ | ■ | ■ | |||
| MOO | Agribusiness ETF | ■ | ||||||||
| NLR | Uranium and Nuclear ETF | ■ | ■ | |||||||
| OIH | Oil Services ETF | ■ | ||||||||
| OUNZ | VanEck Merk Gold ETF | ■ | ||||||||
| PIT | VanEck Commodity Strategy ETF | ■ | ■ | ■ | ■ | |||||
| RAAX | Real Assets ETF | ■ | ■ | ■ | ■ | ■ | ■ | ■ | ■ | ■ |
| REMX | Rare Earth and Strategic Metals ETF | ■ | ||||||||
| SLX | Steel ETF | ■ | ||||||||
| SMOG | Low Carbon Energy ETF | ■ |
OUNZ Prospectus Click Here:prospectus
An investment in the VanEck Merk Gold ETF ("OUNZ," or the “Trust”) is subject to significant risk and may not be suitable for all investors. OUNZ is not an investment company registered under the Investment Company Act of 1940 (the “1940 Act”) and therefore is not subject to the same protections as mutual funds or ETFs registered under the 1940 Act.
More information, including recent performance and current holdings, can be found by clicking the fund names below:
Global Resources Fund: Actively-managed approach to companies with unique competitive advantages associated with traditional commodities and those leading the development of emerging resource applications and technologies.
International Investors Gold Fund: Proven fundamental, bottom-up process emphasizes stock selection based on industry experience to access opportunities across the gold mining sector.
CM Commodity Index Fund: A passively managed fund that offers diversified commodities exposure by spreading its exposure across multiple maturities and maintaining a constant maturity per commodity to mitigate the impact of negative roll yield.
CMCI Commodity Strategy ETF: A passively managed ETF that spreads its exposure across multiple maturities to offer diversified exposure and mitigates the impact of negative roll yield by maintaining a constant maturity per commodity.
VanEck Oil Refiners ETF (CRAK): Provides exposure to an industry that may generally benefit from lower oil prices, a segment that has historically interacted differently with oil prices and market dynamics than other energy segments.
VanEck Energy Income ETF (EINC): Offers exposure to MLPs and energy infrastructure companies that have historically exhibited attractive yield characteristics without burdensome K-1 tax reporting.
VanEck Gold Miners ETF (GDX): The nation's first ETF to offer direct exposure to the gold mining industry. Gold miners have historically shown leverage to gold prices, which can amplify returns when prices rise and losses when they fall.
VanEck Junior Gold Miners ETF (GDXJ): Access to junior gold miners, including smaller exploratory or early development phase companies that are responsible for many gold reserve discoveries worldwide.
Copper and Electrification ETF (EMET): Capture companies involved in the production of the metals that enable the energy transition from fossil fuels to cleaner energy sources and technologies.
VanEck Natural Resources ETF (HAP): Offers exposure to global companies involved in six natural resources segments (including agriculture, energy, metals and renewable energy).
VanEck Agribusiness ETF (MOO): Positioned to meet growing demand as global population growth is driving increasing food demand and the need for efficient agricultural solutions.
VanEck Uranium and Nuclear ETF (NLR): Access to an important segment of the nuclear energy market, which is a significant clean energy source at an inflection point from increasing demand.
VanEck Oil Services ETF (OIH): Invests in highly liquid companies in oil services industry, including both domestic and U.S. listed foreign companies, allowing for enhanced industry representation.
VanEck Merk Gold ETF (OUNZ): Provides investors with a convenient and cost-efficient way to invest in gold through shares with the option to take physical delivery.
VanEck Real Assets ETF (RAAX): Comprehensive allocation strategy that invests across real assets and seeks to reduce volatility by responding to changing market environments.
VanEck Rare Earth and Strategic Metals ETF (REMX): Provides access to the rare earth or strategic metals industry, which supplies key inputs to many of the world’s most advanced technologies.
VanEck Steel ETF (SLX): Access to the steel industry, an industry supporting global industrialization and economic expansion.
VanEck Low Carbon Energy ETF (SMOG): Exposure to low carbon energy that includes not only solar, wind and hydro companies, but also in more recently developing areas of the market such as electric vehicles, battery tech, hydrogen and fuel cells.
VanEck Commodity Strategy ETF (PIT): Actively managed exposure to a broad basket of commodity futures.
To receive more Natural Resources insights, sign up in our subscription center.

Important Disclosures
Index Definitions
Bloomberg Commodity Index is a broadly diversified financial benchmark that tracks the performance of futures contracts on physical commodities. Bloomberg U.S. Aggregate Bond Index is a broad-based benchmark that measures the investment grade, U.S. dollar-denominated, fixed-rate taxable bond market. The index includes Treasuries, government-related and corporate securities, MBS (agency fixed-rate and hybrid ARM pass-throughs), ABS and CMBS (agency and non-agency). Bloomberg U.S. Aggregate Government/Credit Index is a broad-based benchmark that measures the performance of U.S. Dollar denominated U.S. Treasuries, government-related and investment grade U.S. corporate securities that have a remaining maturity of greater than one year. Commodity Composite Price Value is a reconstructed, non-investable gauge of broad commodity prices, indexed to 100 in 1800, that chains and, where series overlap, averages monthly changes from historical wholesale/spot-price series and modern commodity indexes. Price sources include Bezanson/Gray/Hussey, Bezanson, Arthur H. Cole, BLS/NBER, CRB, the Bloomberg Commodity Index and S&P GSCI. EMIX Global Energy Index (discontinued) measures the returns of companies in the oil, gas and consumable fuels extraction industries. EMIX Global Mining ex. Gold & Energy Index (discontinued) measures the returns of companies in the metal and mineral extraction industries excluding gold and energy companies. FTSE NAREIT All Equity REITs Index is a free-float adjusted, market capitalization-weighted index of U.S. Equity REITs. Constituents of the Index include all tax-qualified REITs with more than 50 percent of total assets in qualifying real estate assets other than mortgages secured by real property. Ibbotson SBBI U.S. Intermediate Government Bond Index is an unweighted index that measures the performance of U.S. Treasury and U.S. Government Agency bonds with maturities between four and seven years. Ibbotson SBBI U.S. Long-Term Corporate Bond Index is an unweighted index that measures the performance of U.S. corporate bonds with maturities of seven years or longer. NYSE Arca Gold Miners Index is a modified market capitalization-weighted index composed of publicly traded companies involved primarily in the mining for gold. The Index is calculated and maintained by the New York Stock Exchange. MSCI ACWI Select Energy Producers Index aims to focus on companies in the energy industries that are highly sensitive to underlying prices of energy commodities. The index includes companies at or near the initial phase of energy production that are primarily engaged in the exploration and production of oil and gas or in the production and mining of coal and other consumable fuels related to the generation of energy. MSCI ACWI Select Metals & Mining Producers ex. Gold & Silver Index aims to focus on companies in the industrial and rare earth metals (excluding gold and silver) that are highly sensitive to underlying prices of industrial and rare earth metals. The index includes companies that are primarily engaged in the production or extraction of metals and minerals, in the mining of precious metals excluding gold and silver (e.g. platinum), or in the production of aluminum or steel. S&P 500 Index is widely regarded as the best single gauge of large-cap U.S. equities. The index is a float-adjusted, market-cap-weighted index of 500 leading U.S. companies from across all market sectors including information technology, telecommunications services, utilities, energy, materials, industrials, real estate, financials, health care, consumer discretionary, and consumer staples. World Bank Commodity Price Data – Energy Index is sourced from the World Bank Group. The World Bank Commodity Markets Prices Data is provided via “The Pink Sheet,” which is a monthly report that monitors global commodity price movements.
Risk Considerations
This is not an offer to buy or sell, or a recommendation to buy or sell any of the securities, financial instruments or digital assets mentioned herein. The information presented does not involve the rendering of personalized investment, financial, legal, tax advice, or any call to action. Certain statements contained herein may constitute projections, forecasts and other forward-looking statements, which do not reflect actual results, are for illustrative purposes only, are valid as of the date of this communication, and are subject to change without notice. Actual future performance of any assets or industries mentioned are unknown. Information provided by third party sources are believed to be reliable and have not been independently verified for accuracy or completeness and cannot be guaranteed. VanEck does not guarantee the accuracy of third-party data. The information herein represents the opinion of the author(s), but not necessarily those of VanEck or its other employees.
VanEck Merk Gold ETF (OUNZ) Disclosures
VanEck Merk® Gold ETF: This material must be preceded or accompanied by a prospectus for the VanEck Merk Gold ETF (the “Trust”). Before investing, you should carefully consider the Trust’s investment objectives, risks, charges and expenses. This and other information is in the prospectus, a copy of which may be obtained by visiting vaneck.com/ounz or calling 800.826.2333. Please read the prospectus carefully before you invest. Investing involves significant risk, including possible loss of principal. The Trust is not an investment company registered under the Investment Company Act of 1940 or a commodity pool for the purposes of the Commodity Exchange Act. Shares of the Trust are not subject to the same regulatory requirements as mutual funds. Because shares of the Trust are intended to reflect the price of the gold held in the Trust, the market price of the shares is subject to fluctuations similar to those affecting gold prices. Additionally, shares of the Trust are bought and sold at market price, not at net asset value (“NAV”). Brokerage commissions will reduce returns. The sponsor of the VanEck Merk Gold ETF is Merk Investments LLC (the “Sponsor”). Van Eck Securities Corporation provides marketing services to the Trust.
The request for redemption of shares for gold is subject to a number of risks including but not limited to the potential for the price of gold to decline during the time between the submission of the request and delivery. Delivery may take a considerable amount of time depending on your location.
The Sponsor of the Trust is Merk Investments, LLC. The Marketing Agent for the Trust is Van Eck Securities Corporation.
© Merk Investments LLC. © Van Eck Associates Corporation.
VanEck ETFs and Mutual Funds
The principal risks of investing in VanEck ETFs and mutual funds include sector, market, economic, political, foreign currency, world event, index tracking, active management, social media analytics, derivatives, blockchain, commodities and non-diversification risks, as well as fluctuations in net asset value and the risks associated with investing in less developed capital markets. VanEck ETFs may also be subject to authorized participant concentration, no guarantee of active trading market, trading issues, passive management, fund shares trading, premium/discount risk and liquidity of fund shares risks. VanEck ETFs or mutual funds may loan their securities, which may subject them to additional credit and counterparty risk. ETFs or mutual funds that invest in high-yield securities are subject to subject to risks associated with investing in high-yield securities; which include a greater risk of loss of income and principal than funds holding higher-rated securities; concentration risk; credit risk; hedging risk; interest rate risk; and short sale risk. ETFs or mutual funds that invest in companies with small capitalizations are subject to elevated risks, which include, among others, greater volatility, lower trading volume and less liquidity than larger companies. Please see the prospectus of each Fund for more complete information regarding each Fund’s specific risks.
Investing involves substantial risk and high volatility, including possible loss of principal. An investor should consider the investment objective, risks, charges and expenses of a Fund carefully before investing. To obtain a prospectus and summary prospectus, which contain this and other information, call 800.826.2333 or visit vaneck.com. Please read the prospectus and summary prospectus carefully before investing.
© Van Eck Securities Corporation, Distributor, a wholly owned subsidiary of Van Eck Associates Corporation.
Related Funds
Important Disclosures
Index Definitions
Bloomberg Commodity Index is a broadly diversified financial benchmark that tracks the performance of futures contracts on physical commodities. Bloomberg U.S. Aggregate Bond Index is a broad-based benchmark that measures the investment grade, U.S. dollar-denominated, fixed-rate taxable bond market. The index includes Treasuries, government-related and corporate securities, MBS (agency fixed-rate and hybrid ARM pass-throughs), ABS and CMBS (agency and non-agency). Bloomberg U.S. Aggregate Government/Credit Index is a broad-based benchmark that measures the performance of U.S. Dollar denominated U.S. Treasuries, government-related and investment grade U.S. corporate securities that have a remaining maturity of greater than one year. Commodity Composite Price Value is a reconstructed, non-investable gauge of broad commodity prices, indexed to 100 in 1800, that chains and, where series overlap, averages monthly changes from historical wholesale/spot-price series and modern commodity indexes. Price sources include Bezanson/Gray/Hussey, Bezanson, Arthur H. Cole, BLS/NBER, CRB, the Bloomberg Commodity Index and S&P GSCI. EMIX Global Energy Index (discontinued) measures the returns of companies in the oil, gas and consumable fuels extraction industries. EMIX Global Mining ex. Gold & Energy Index (discontinued) measures the returns of companies in the metal and mineral extraction industries excluding gold and energy companies. FTSE NAREIT All Equity REITs Index is a free-float adjusted, market capitalization-weighted index of U.S. Equity REITs. Constituents of the Index include all tax-qualified REITs with more than 50 percent of total assets in qualifying real estate assets other than mortgages secured by real property. Ibbotson SBBI U.S. Intermediate Government Bond Index is an unweighted index that measures the performance of U.S. Treasury and U.S. Government Agency bonds with maturities between four and seven years. Ibbotson SBBI U.S. Long-Term Corporate Bond Index is an unweighted index that measures the performance of U.S. corporate bonds with maturities of seven years or longer. NYSE Arca Gold Miners Index is a modified market capitalization-weighted index composed of publicly traded companies involved primarily in the mining for gold. The Index is calculated and maintained by the New York Stock Exchange. MSCI ACWI Select Energy Producers Index aims to focus on companies in the energy industries that are highly sensitive to underlying prices of energy commodities. The index includes companies at or near the initial phase of energy production that are primarily engaged in the exploration and production of oil and gas or in the production and mining of coal and other consumable fuels related to the generation of energy. MSCI ACWI Select Metals & Mining Producers ex. Gold & Silver Index aims to focus on companies in the industrial and rare earth metals (excluding gold and silver) that are highly sensitive to underlying prices of industrial and rare earth metals. The index includes companies that are primarily engaged in the production or extraction of metals and minerals, in the mining of precious metals excluding gold and silver (e.g. platinum), or in the production of aluminum or steel. S&P 500 Index is widely regarded as the best single gauge of large-cap U.S. equities. The index is a float-adjusted, market-cap-weighted index of 500 leading U.S. companies from across all market sectors including information technology, telecommunications services, utilities, energy, materials, industrials, real estate, financials, health care, consumer discretionary, and consumer staples. World Bank Commodity Price Data – Energy Index is sourced from the World Bank Group. The World Bank Commodity Markets Prices Data is provided via “The Pink Sheet,” which is a monthly report that monitors global commodity price movements.
Risk Considerations
This is not an offer to buy or sell, or a recommendation to buy or sell any of the securities, financial instruments or digital assets mentioned herein. The information presented does not involve the rendering of personalized investment, financial, legal, tax advice, or any call to action. Certain statements contained herein may constitute projections, forecasts and other forward-looking statements, which do not reflect actual results, are for illustrative purposes only, are valid as of the date of this communication, and are subject to change without notice. Actual future performance of any assets or industries mentioned are unknown. Information provided by third party sources are believed to be reliable and have not been independently verified for accuracy or completeness and cannot be guaranteed. VanEck does not guarantee the accuracy of third-party data. The information herein represents the opinion of the author(s), but not necessarily those of VanEck or its other employees.
VanEck Merk Gold ETF (OUNZ) Disclosures
VanEck Merk® Gold ETF: This material must be preceded or accompanied by a prospectus for the VanEck Merk Gold ETF (the “Trust”). Before investing, you should carefully consider the Trust’s investment objectives, risks, charges and expenses. This and other information is in the prospectus, a copy of which may be obtained by visiting vaneck.com/ounz or calling 800.826.2333. Please read the prospectus carefully before you invest. Investing involves significant risk, including possible loss of principal. The Trust is not an investment company registered under the Investment Company Act of 1940 or a commodity pool for the purposes of the Commodity Exchange Act. Shares of the Trust are not subject to the same regulatory requirements as mutual funds. Because shares of the Trust are intended to reflect the price of the gold held in the Trust, the market price of the shares is subject to fluctuations similar to those affecting gold prices. Additionally, shares of the Trust are bought and sold at market price, not at net asset value (“NAV”). Brokerage commissions will reduce returns. The sponsor of the VanEck Merk Gold ETF is Merk Investments LLC (the “Sponsor”). Van Eck Securities Corporation provides marketing services to the Trust.
The request for redemption of shares for gold is subject to a number of risks including but not limited to the potential for the price of gold to decline during the time between the submission of the request and delivery. Delivery may take a considerable amount of time depending on your location.
The Sponsor of the Trust is Merk Investments, LLC. The Marketing Agent for the Trust is Van Eck Securities Corporation.
© Merk Investments LLC. © Van Eck Associates Corporation.
VanEck ETFs and Mutual Funds
The principal risks of investing in VanEck ETFs and mutual funds include sector, market, economic, political, foreign currency, world event, index tracking, active management, social media analytics, derivatives, blockchain, commodities and non-diversification risks, as well as fluctuations in net asset value and the risks associated with investing in less developed capital markets. VanEck ETFs may also be subject to authorized participant concentration, no guarantee of active trading market, trading issues, passive management, fund shares trading, premium/discount risk and liquidity of fund shares risks. VanEck ETFs or mutual funds may loan their securities, which may subject them to additional credit and counterparty risk. ETFs or mutual funds that invest in high-yield securities are subject to subject to risks associated with investing in high-yield securities; which include a greater risk of loss of income and principal than funds holding higher-rated securities; concentration risk; credit risk; hedging risk; interest rate risk; and short sale risk. ETFs or mutual funds that invest in companies with small capitalizations are subject to elevated risks, which include, among others, greater volatility, lower trading volume and less liquidity than larger companies. Please see the prospectus of each Fund for more complete information regarding each Fund’s specific risks.
Investing involves substantial risk and high volatility, including possible loss of principal. An investor should consider the investment objective, risks, charges and expenses of a Fund carefully before investing. To obtain a prospectus and summary prospectus, which contain this and other information, call 800.826.2333 or visit vaneck.com. Please read the prospectus and summary prospectus carefully before investing.
© Van Eck Securities Corporation, Distributor, a wholly owned subsidiary of Van Eck Associates Corporation.