VanEck Mid-September 2026 Bitcoin ChainCheck
September 18, 2026
Read Time 10+ MIN
The original version contained analysis on digital asset treasury (DAT) corporate governance that did not meet our standards. We have removed it while we conduct additional research.
Please note that VanEck may have a position(s) in the digital asset(s) and companies described below.
Key Takeaways
- Power, not chips, is the binding constraint: NVDA, AMD, and AVGO are expected to need roughly 30GW of US capacity through 2027 against annual additions of 15 to 25GW, and only ~2% of the interconnection queue reached the grid in 2025.
- Miners own the scarce asset: Our re-underwritten base case implies ~83% average upside across our powered-land holdings, with the market still ascribing little value to uncontracted pipeline or the terminal value of signed leases.
This month we step away from Bitcoin network fundamentals to tackle one issue in the bitcoin equity complex: the miners converting to AI data centers, where the constraint is megawatts. It comes down to a question that matters for anyone trying to beat bitcoin through equities: what scarce asset does the company control, and how much of the value it creates actually reaches shareholders?
Miners: Power Is the Bottleneck, Not Chips
We re-underwrote US data center supply and demand from the ground up. NVDA, AMD, and AVGO need roughly 30 gigawatts (GW) of US power through 2027 while the grid can deliver 15 to 25GW a year, only ~2% of the interconnection queue was energized in 2025, and firm capacity is shrinking as coal retires faster than gas arrives. That puts the miners in possession of the scarce asset. We see more risk that NVDA misses estimates because its customers cannot get power than that the miners fail to lease their megawatts. Our re-underwritten base case implies ~83% average upside across our powered-land holdings.
This takeaway feeds directly into how we invest: we like miners with energized power because we expect the power shortage to persist.
Bitcoin Miners Have the Megawatts: Power, Not Chips, Is the AI Bottleneck
Given the bullish commentary from leading AI names such as NVDA, AMD, and AVGO during the recent earnings cycle, we examined expected US data center capacity coming online over the next few years and found a likely shortfall in the ability to energize GPUs shipping in 2027. We expect 15 to 25GW of US data center capacity to come online annually over the next 2 years, with the lower end more likely in 2026. Over that same period, the combination of NVDA, AMD, and AVGO is likely to require approximately 30GW.
Our Three Takeaways: Power Scarcity, NVDA Risk, and Miner Upside
We reiterate our conviction in a powered land shortage: The binding constraint is not capital or demand but process throughput in securing power. Only ~2% of the interconnection queue reached commercial operation in 2025, median request to operation has stretched to 61 months from 22 in 2008, and net firm dispatchable capacity suitable for data centers contracts over 2026-2028 as coal retires faster than gas arrives. With interconnection queues shifting from first in first out to batch and cluster studies, the process is becoming more selective. This favors operators with energized sites and established utility and community relationships over those holding long-time queue positions. We see bitcoin miners uniquely positioned in that regard.
We see greater risk to NVDA missing estimates on a GW shortage than to miners failing to monetize their MWs: NVDA’s calendar 2027 data center revenue implies ~11GW of US capacity needed at ~$37B per GW, meaning that every 1GW its customers cannot energize represents ~$37B of revenue (~6% of total) that NVDA could potentially lose. A 3GW shortfall, plausible if additions land at the low end of our 15-25GW range, would imply an ~18% revenue drop. Natural offsets to this could be greater mix of sales to non-US regions, or specifically China.
The miners sit on the other end of this trade, already holding energized power with expansion opportunities that have been in the works for years. Their risk is leaving uncontracted megawatt (MW) value on the table, which companies like NVDA/AMD/AVGO are incentivized to avoid, not failing to monetize them.
We see more risk that NVDA misses estimates because its customers cannot get power than that the miners fail to lease their megawatts.
Re-underwriting the thesis, we see ~83% average upside across our powered-land holdings: Using a mix of sum-of-the-parts (SOTP) and discounted cash flow (DCF) analyses, our base case implies roughly 83% average upside across our bitcoin miner basket. We believe the market continues to ascribe little to no value to 2 components: the uncontracted power pipeline, which this analysis shows to be highly valuable, and the terminal value of the leases themselves. Over time, we expect both to accrue value meaningfully to the companies and to shareholders. These figures are the results of a simulation based on our research, are for illustrative purposes only, and are not a projection of future performance; see Risk Considerations below.
Demand: NVDA, AMD, and AVGO alone are expected to demand ~30GW of power across 2026-2027 (~11GW in 2026 and nearly 20GW in 2027) based on revenue expectations for each: Starting with each company’s respective AI/data center revenue expectations for the next 2 years, we back into the implied power generation needs using management guided revenue-per-GW metrics where available, and sense-check this (for NVDA) with a bottoms-up approach based on expected average unit price by GPU mix and estimated power draw per unit. We find that NVDA will need ~20GW, AMD ~4-5GW, and AVGO ~6GW through 2027, together representing an estimated 60-100% of total US data center capacity expected to come online over the timeframe.
Top Providers Demand, Calendar Years 2026-27 (GW)
| Top providers demand, CY26-27 (GW) | |||
| Provider | CY2026 | CY2027 | Total |
| NVDA (70% of global) | ~8 | ~11 | ~20 |
| AMD (Meta + OpenAI) | ~1 | ~3-4 | ~4-5 |
| AVGO XPU (80% of global) | ~2 | ~4 | ~6 |
| Combined | ~11 | ~18-19 | ~30 |
| Against expected US capacity additions | ||||
| Supply scenario | Additions | NVDA (%) | + AMD (%) | + AVGO (%) |
| High (25 GW/yr) | 50 GW | 40 | 49 | 60 |
| Mid (20 GW/yr) | 40 GW | 50 | 61 | 75 |
| Low (15 GW/yr) | 30 GW | 67 | 82 | 100 |
Source: Company reports, VanEck Research, as of 9/14/2026. Past performance is not a guarantee of future results. Not intended as a recommendation to buy or sell any securities named herein. For illustrative purposes only. Not a projection of future results.
Supply: We estimate 15-25GW of US data center capacity coming online annually over the next 2 years: Based on an aggregate of third-party sources and our own estimates, US data center capacity of ~50GW at the end of 2025 is projected to grow towards ~80GW by the end of 2027, implying annual additions of ~15GW. This pace is consistent with Bernstein’s tracked active capacity growth of ~13GW (North America) over the last 12 months ended August 2026. We view this figure as more of a floor and see the ~70GW currently under construction in North America implying a possible ceiling of ~25GW in the US over the next 2 years, given the typical 18-24 month build cycles and the likelihood of delays.
Annual US Data Center Additions (GW)
| Source | 2025A | 2026E | 2027E |
| GS Global Tech (451 Research) | — | 13.6 | 18.8 |
| GS Commodities (Aterio) | 8.5 | 13.6 | 36.0 |
| Morgan Stanley (Own model) | 9.6 | 12.1 | 15.3 |
| Eaton / Bernstein (Eaton order flow) | 11.0 | 17.0 | — |
| Bernstein tracked (Aterio) | — | 13 | — |
| Range ex-outlier | 8.5-11 | 12-17 | 15-19 |
Cumulative US Data Center capacity (GW)
| Source | End-2025 | End-2027 |
| GS Commodities | ~44 | 95 |
| Morgan Stanley (implied) | ~47 | ~74 |
| FERC | ~50 | — |
| Bernstein (North America Est) | ~52 | — |
| Estimate | ~50 | ~80 |
Source: Goldman Sachs Research, Bernstein Research, FERC, EIA, Morgan Stanley Research, as of 9/14/2026. Past performance is not a guarantee of future results. Not intended as a recommendation to buy or sell any securities named herein. For illustrative purposes only. Not a projection of future results.
Only ~2% of the queue was grid connected in 2025, underscoring how long the backlog could take to clear: Entering 2025 there were 2,290GW of generation in the US grid interconnection queue. Over the year just 53GW (~2%) was grid-connected while 756GW (~33%) was withdrawn, leaving a year-end 2025 queue of 2,061GW. This is consistent with long-term trends, with the Lawrence Berkeley National Laboratory (LBNL) noting that only ~13% of capacity that entered the queue between 2000 and 2020 had reached operation by the end of 2025, while 75% was withdrawn. Additionally, 41% of capacity that executed interconnection agreements between 2000 and 2022 had withdrawn by the end of 2025.
The Queue Is Not a Pipeline
US Generation Interconnection Queue, Total Capacity (GW)
| Flow | GW | Detail |
| Opening queue, end-2024 | 2,404 | 2,290 active + 114 suspended |
| + New applications | +603 | ~2,300 requests |
| − Reached commercial operation | −53 | 2% throughput |
| − Withdrawn | −756 | 31% of opening |
| = Closing queue, end-2025 | 2,198 | 2,061 active + 137 suspended |
Source: VanEck Research, Lawrence Berkeley National Laboratory, US Energy Information Administration, as of 9/14/2026. Past performance is not a guarantee of future results. Not intended as a recommendation to buy or sell any securities named herein.
Elevated withdrawal rates are partially transitory, but likely to persist for now: A couple of reasons for the elevated number of withdrawals in the last 1-2 years include 1) phasing out of One Big Beautiful Bill Act (OBBBA) tax credits that pulled forward cancellations of projects that would have relied on them, 2) queue closures and caps in regions such as MISO and NYISO, and 3) FERC reform that imposed higher at-risk deposits and escalating withdrawal penalties, forcing projects that had been sitting free in the queue to suddenly face real costs to stay. While some of these are one-time in nature, the reforms are designed to raise the withdrawal rate, as higher deposits and readiness requirements exist to push weak projects out faster. A cleaner queue should mean a higher rejection rate at the front and a higher completion rate at the back, but it remains to be seen whether this materializes.
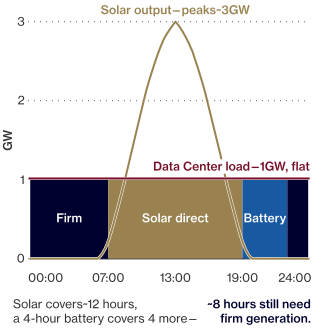
Further, a significant portion of capacity added from the queue has been renewables, which is better suited as a complement for data center capacity, rather than a substitute: While solar, wind, and storage can support data centers, to date they have not proven reliable as a standalone power supply. A 2026 study from LUT University in Finland found that an off-grid renewable data center needs ~7x its baseload requirement in nameplate generation, in addition to backup power. This is because longer duration storage (>4 hours), which is needed to cover the hours when it’s dark or not windy, is not economical to build today. Battery costs scale directly with duration since the energy is stored within the cells themselves, and a battery sized for the overnight gap created by solar power sits idle most of the year. A behind-the-meter (BTM) gas turbine puts capital into the generation rather than in storing energy, which is why operators are opting to pair renewables with BTM turbines rather than adding more storage.
This issue is further exacerbated by ~40GW of coal and oil that is expected to roll off the grid/retire in the coming years. If we assume 14GW retires each year, this reduces the EIA’s expected 86GW of gross additions towards ~72GW. Given the mix coming onto the grid is primarily solar, wind, and storage while the mix coming off is coal and oil, net firm capacity (the kind data centers need) is contracting even as total capacity sets records. This makes existing energized sites the scarce assets, which is why operators with power already in place are executing leases at improving rates (converting a site that is already interconnected sidesteps a queue that takes 61 months to clear). Until the gas capacity now entering the queue gets connected, that scarcity should persist.
Net firm capacity, the kind data centers need, is contracting even as total capacity sets records.
Record Additions, Shrinking Firmness
The Grid Is Adding Energy, Not Dispatchable Capacity
| EIA: planned US additions, 2026 (gross, GW) | |||
| Technology | GW | Share (%) | Character |
| Solar | 43.4 | 51 | Intermittent |
| Battery storage | 24.3 | 28 | Shifts only |
| Wind | 11.8 | 14 | Intermittent |
| Gas and other | ~6.5 | 7 | Firm (gas ~3) |
| Total | 86.0 | ~14 GW avg energy | |
| FERC: high-probability net additions, Jan '26 - Dec '28 (GW) | |||
| Technology | GW | Character | |
| Solar | +86.1 | Intermittent | |
| Wind | +19.8 | Intermittent | |
| Natural gas | +8.2 | Firm | |
| Nuclear, hydro, geothermal | +0.8 | Firm | |
| Coal | −40.8 | Firm, retiring | |
| Oil | −1.6 | Firm, retiring | |
| Net firm dispatchable | −33.4 | vs +106 intermittent | |
Source: VanEck Research, US Energy Information Administration, Federal Energy Regulatory Commission, as of 9/14/2026. Past performance is not a guarantee of future results. Not intended as a recommendation to buy or sell any securities named herein. For illustrative purposes only. Not a projection of future results.
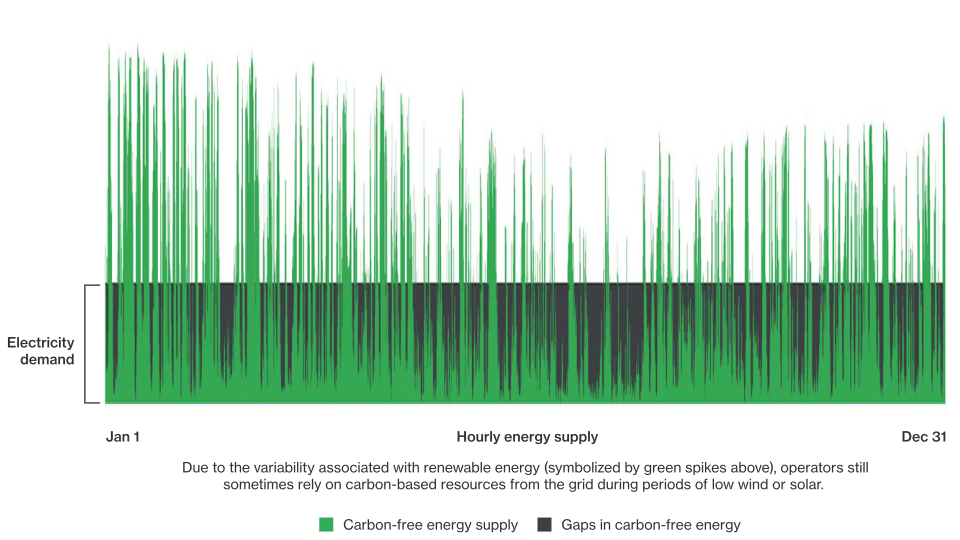
Hyperscalers’ own endeavors highlight the inability of renewables to power data centers: Google has been among the most determined corporate buyers of clean power on earth, signing more than 240 agreements for ~35GW of clean energy since 2010. That said, in its 2026 Environmental Report the company states plainly that even companies meeting a 100% annual match “continue to rely on power generated by fossil fuels during times when, or in places where, carbon-free generation isn’t available.” Its most advanced hourly-matching arrangement, a 500MW portfolio of wind, solar, hydro, and storage supplying its Virginia campus, was structured to deliver just 90% of hours carbon-free, well short of the ~99.99% availability a data center requires.
Hourly Carbon-Free Energy (CFE) Performance at a Hypothetical Site
Source: Google Environmental Report 2026, as of 9/14/2026. Past performance is not a guarantee of future results. Not intended as a recommendation to buy or sell any securities named herein. For illustrative purposes only. Not a projection of future results.
Serving 1GW of Flat Load With 4GW of Solar
Typical Summer Day, 25% Capacity Factor

Source: VanEck Research, as of 9/14/2026. Past performance is not a guarantee of future results. Not intended as a recommendation to buy or sell any securities named herein. For illustrative purposes only. Not a projection of future results.
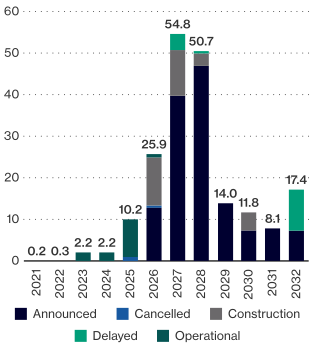
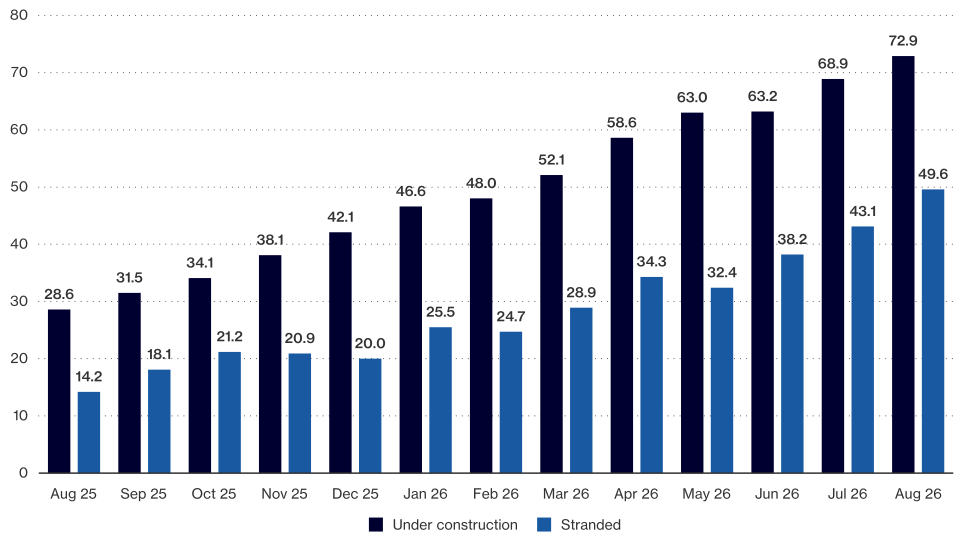
Construction progress suggests delays to planned operation dates, with potential supply/demand balance unlikely until 2030: According to Currence, only ~50% of the announced data center capacity to be operational in 2026 is under construction, while significantly less is under construction for 2027-2028. Notably, a much higher portion of the 11.8GW of currently planned power for 2030 is underway, suggesting this is when we could start to see some supply/demand balance. Further, while active capacity under construction in North America has surpassed 70GW, stranded capacity (delayed + canceled + not approved / withdrawn) continues to increase as well. Considering 18-24 month build times and a multi-year phased build for many of these sites, it’s clear that much of the recently started construction will not reach operation until beyond 2028.
US Data Center Pipeline, by Operational Date (GW)

Source: Currence AI, as of 9/14/2026. Past performance is not a guarantee of future results. Not intended as a recommendation to buy or sell any securities named herein. For illustrative purposes only. Not a projection of future results.
Capacity Under Construction vs. Stranded, Monthly (GW)
Source: Bernstein Research, VanEck Research, as of 9/14/2026. Past performance is not a guarantee of future results. Not intended as a recommendation to buy or sell any securities named herein.
Power for data centers shifting from PJM to ERCOT/MISO, while queues shift from renewables to gas: Today, PJM holds the largest installed data center fleet but a much smaller queue than other regions, as ERCOT, MISO, and Western states continue to take share. We also expect natural gas and other data center-capable power to become more prevalent in the coming years, as the shift towards batch and cluster studies from “first in first out” gives them a better case to be approved than in the past with firm AI commitments backing them. Notably, active gas capacity in the queue rose 86% to 253GW in 2025, while solar fell 19%, storage 16%, and wind 19%.
Queued gas cannot arrive on time, and that constraint is where we see our INNIO Group (INIO) and Doncasters (DPC) exposure paying off: Only ~18% of active gas capacity in US interconnection queues holds a draft or executed agreement (vs >30% for solar and wind), and turbine lead times run 3-5 years with the major original equipment manufacturers (OEMs) effectively sold out through 2028. Developers are responding by going behind the meter, with >100GW of on-site natural gas generation now announced in the US.
INIO sits directly in this order flow with equipment order backlog of $6.6B (up from $3.6B exiting 2025) led by increasing behind-the-meter data center demand.
DPC approaches the same shortage from the other side, manufacturing precision superalloy castings that go into industrial gas turbines, supplying the OEMs whose capacity is sold out for years. DPC carries a near $1B order backlog, with ~70% of that revenue under long-term agreements. We view it as owning the bottleneck rather than competing against it.
Interconnection Queue and Data Center Share by Region
| Region | Main states | Installed | Queue | Ratio | DC share (%) | Process |
| West | OR, AZ, NV, UT, CO, NM, WA, ID | n/d | 567 | n/d | ~14 | 10% completion |
| ERCOT | TX (~90% of state load) | 173 | 408 | 2.4x | ~12 | 24 mo; 24% completion |
| MISO | MI, IN, IL, WI, MN, IA, MO, LA, AR | 212 | 382 | 1.8x | ~8 | 13%; queue capped |
| CAISO | CA | 95 | 191 | 2.0x | ~3 | 8%; no new requests |
| SPP | KS, OK, NE, ND, SD, NM | 104 | 171 | 1.6x | <2 | 15%; HILL fast-track |
| Southeast | GA, TN, FL, NC, SC, AL | n/d | 153 | n/d | ~7 | 17%; gas hub |
| PJM | VA, OH, PA, NJ, MD, IL, WV, IN | 226 | 144 | 0.6x | 36 | Paused to 2026 |
| NYISO / ISO-NE | NY / MA, CT, ME, NH, RI, VT | 46 / 38 | 29 / 15 | 0.6 / 0.4x | <2 | No new requests |
Source: VanEck Research, FERC, EIA, as of 9/14/2026. Past performance is not a guarantee of future results. Not intended as a recommendation to buy or sell any securities named herein.
Top States, Active Capacity (July 2026)
| Top states, active capacity (Jul-26) | |||
| State | GW | Share (%) | Market |
| Virginia | 11.7 GW | 24 | PJM |
| Texas | 6.0 GW | 12 | ERCOT |
| Oregon | 3.9 GW | 8 | Non-RTO West |
| Ohio | 3.8 GW | 8 | PJM |
| Arizona | 2.9 GW | 6 | Non-RTO West |
| Georgia | 2.3 GW | 5 | Southeast |
| Iowa / Illinois | 2.1 / 1.8 GW | 8 | MISO / PJM |
| US total | ~52 GW | 24 CAGR | since 2020 |
Source: VanEck Research, FERC, EIA, as of 9/14/2026. Past performance is not a guarantee of future results. Not intended as a recommendation to buy or sell any securities named herein.
Frequently Asked Questions
Why are bitcoin miners pivoting to AI data centers?
Because the binding constraint on AI compute is power, not chips. NVDA, AMD, and AVGO are expected to need roughly 30GW of US capacity through 2027 while annual US additions run 15 to 25GW, and only ~2% of the interconnection queue reached commercial operation in 2025. Miners already hold energized sites and utility relationships, which makes their megawatts the scarce asset in that trade.
To receive more Digital Assets insights, sign up in our subscription center.


Disclosures
Definitions
Bitcoin (BTC) is a decentralized digital currency without a central bank or single administrator. It can be sent from user to user on the peer-to-peer Bitcoin network without intermediaries.
Ether (ETH) is the native asset of the Ethereum network, used to pay for transactions and computation on that network.
Risk Considerations
This is not an offer to buy or sell, or a recommendation to buy or sell any of the securities, financial instruments or digital assets mentioned herein. The information presented does not involve the rendering of personalized investment, financial, legal, tax advice, or any call to action. Certain statements contained herein may constitute projections, forecasts and other forward-looking statements, which do not reflect actual results, are for illustrative purposes only, are valid as of the date of this communication, and are subject to change without notice. Actual future performance of any assets or industries mentioned are unknown. Information provided by third party sources are believed to be reliable and have not been independently verified for accuracy or completeness and cannot be guaranteed. VanEck does not guarantee the accuracy of third party data. The information herein represents the opinion of the author(s), but not necessarily those of VanEck or its other employees.
The information, valuation scenarios and price targets presented on any digital assets in this blog are not intended as financial advice, a recommendation to buy or sell these digital assets, or any call to action. There may be risks or other factors not accounted for in these scenarios that may impede the performance these digital assets; their actual future performance is unknown, and may differ significantly from any valuation scenarios or projections/forecasts herein. Any projections, forecasts or forward-looking statements included herein are the results of a simulation based on our research, are valid as of the date of this communication and subject to change without notice, and are for illustrative purposes only. Please conduct your own research and draw your own conclusions.
Past performance is not an indication, or guarantee, of future results. Hypothetical or model performance results have certain inherent limitations. Unlike an actual performance record, simulated results do not represent actual trading, and accordingly, may have undercompensated or overcompensated for the impact, if any, of certain market factors such as market disruptions and lack of liquidity. In addition, hypothetical trading does not involve financial risk and no hypothetical trading record can completely account for the impact of financial risk in actual trading (for example, the ability to adhere to a particular trading program in spite of trading losses). Hypothetical or model performance is designed with benefit of hindsight.
Index performance is not representative of fund performance. It is not possible to invest directly in an index.
Investments in digital assets and Web3 companies are highly speculative and involve a high degree of risk. These risks include, but are not limited to: the technology is new and many of its uses may be untested; intense competition; slow adoption rates and the potential for product obsolescence; volatility and limited liquidity, including but not limited to, inability to liquidate a position; loss or destruction of key(s) to access accounts or the blockchain; reliance on digital wallets; reliance on unregulated markets and exchanges; reliance on the internet; cybersecurity risks; and the lack of regulation and the potential for new laws and regulation that may be difficult to predict. Moreover, the extent to which Web3 companies or digital assets utilize blockchain technology may vary, and it is possible that even widespread adoption of blockchain technology may not result in a material increase in the value of such companies or digital assets.
Digital asset prices are highly volatile, and the value of digital assets, and Web3 companies, can rise or fall dramatically and quickly. If their value goes down, there’s no guarantee that it will rise again. As a result, there is a significant risk of loss of your entire principal investment.
Digital assets are not generally backed or supported by any government or central bank and are not covered by FDIC or SIPC insurance. Accounts at digital asset custodians and exchanges are not protected by SPIC and are not FDIC insured. Furthermore, markets and exchanges for digital assets are not regulated with the same controls or customer protections available in traditional equity, option, futures, or foreign exchange investing.
Digital assets include, but are not limited to, cryptocurrencies, tokens, NFTs, assets stored or created using blockchain technology, and other Web3 products.
Web3 companies include but are not limited to, companies that involve the development, innovation, and/or utilization of blockchain, digital assets, or crypto technologies.
All investing is subject to risk, including the possible loss of the money you invest. As with any investment strategy, there is no guarantee that investment objectives will be met and investors may lose money. Diversification does not ensure a profit or protect against a loss in a declining market. Past performance is no guarantee of future performance.
© Van Eck Associates Corporation
Disclosures
Definitions
Bitcoin (BTC) is a decentralized digital currency without a central bank or single administrator. It can be sent from user to user on the peer-to-peer Bitcoin network without intermediaries.
Ether (ETH) is the native asset of the Ethereum network, used to pay for transactions and computation on that network.
Risk Considerations
This is not an offer to buy or sell, or a recommendation to buy or sell any of the securities, financial instruments or digital assets mentioned herein. The information presented does not involve the rendering of personalized investment, financial, legal, tax advice, or any call to action. Certain statements contained herein may constitute projections, forecasts and other forward-looking statements, which do not reflect actual results, are for illustrative purposes only, are valid as of the date of this communication, and are subject to change without notice. Actual future performance of any assets or industries mentioned are unknown. Information provided by third party sources are believed to be reliable and have not been independently verified for accuracy or completeness and cannot be guaranteed. VanEck does not guarantee the accuracy of third party data. The information herein represents the opinion of the author(s), but not necessarily those of VanEck or its other employees.
The information, valuation scenarios and price targets presented on any digital assets in this blog are not intended as financial advice, a recommendation to buy or sell these digital assets, or any call to action. There may be risks or other factors not accounted for in these scenarios that may impede the performance these digital assets; their actual future performance is unknown, and may differ significantly from any valuation scenarios or projections/forecasts herein. Any projections, forecasts or forward-looking statements included herein are the results of a simulation based on our research, are valid as of the date of this communication and subject to change without notice, and are for illustrative purposes only. Please conduct your own research and draw your own conclusions.
Past performance is not an indication, or guarantee, of future results. Hypothetical or model performance results have certain inherent limitations. Unlike an actual performance record, simulated results do not represent actual trading, and accordingly, may have undercompensated or overcompensated for the impact, if any, of certain market factors such as market disruptions and lack of liquidity. In addition, hypothetical trading does not involve financial risk and no hypothetical trading record can completely account for the impact of financial risk in actual trading (for example, the ability to adhere to a particular trading program in spite of trading losses). Hypothetical or model performance is designed with benefit of hindsight.
Index performance is not representative of fund performance. It is not possible to invest directly in an index.
Investments in digital assets and Web3 companies are highly speculative and involve a high degree of risk. These risks include, but are not limited to: the technology is new and many of its uses may be untested; intense competition; slow adoption rates and the potential for product obsolescence; volatility and limited liquidity, including but not limited to, inability to liquidate a position; loss or destruction of key(s) to access accounts or the blockchain; reliance on digital wallets; reliance on unregulated markets and exchanges; reliance on the internet; cybersecurity risks; and the lack of regulation and the potential for new laws and regulation that may be difficult to predict. Moreover, the extent to which Web3 companies or digital assets utilize blockchain technology may vary, and it is possible that even widespread adoption of blockchain technology may not result in a material increase in the value of such companies or digital assets.
Digital asset prices are highly volatile, and the value of digital assets, and Web3 companies, can rise or fall dramatically and quickly. If their value goes down, there’s no guarantee that it will rise again. As a result, there is a significant risk of loss of your entire principal investment.
Digital assets are not generally backed or supported by any government or central bank and are not covered by FDIC or SIPC insurance. Accounts at digital asset custodians and exchanges are not protected by SPIC and are not FDIC insured. Furthermore, markets and exchanges for digital assets are not regulated with the same controls or customer protections available in traditional equity, option, futures, or foreign exchange investing.
Digital assets include, but are not limited to, cryptocurrencies, tokens, NFTs, assets stored or created using blockchain technology, and other Web3 products.
Web3 companies include but are not limited to, companies that involve the development, innovation, and/or utilization of blockchain, digital assets, or crypto technologies.
All investing is subject to risk, including the possible loss of the money you invest. As with any investment strategy, there is no guarantee that investment objectives will be met and investors may lose money. Diversification does not ensure a profit or protect against a loss in a declining market. Past performance is no guarantee of future performance.
© Van Eck Associates Corporation