Welcome to VanEck
Select Investor Type
15 October 2023
The cryptocurrency market has been through its fair share of ups and downs, with recent times being characterized by a bear market. However, several indicators are suggesting that the tide may be turning. In this article, we'll explore five compelling reasons why the bear market might be coming to an end sooner than expected.
Explanation: The four-year cycle in cryptocurrency refers to a pattern where the market experiences significant movements roughly every four years. This is closely tied to Bitcoin's halving events, which occur approximately every four years.
This year marks the initiation of a new four-year cycle. Historically, this has been an optimistic sign for the crypto market. Based on past trends, we can anticipate a bull market in the next two to three years.
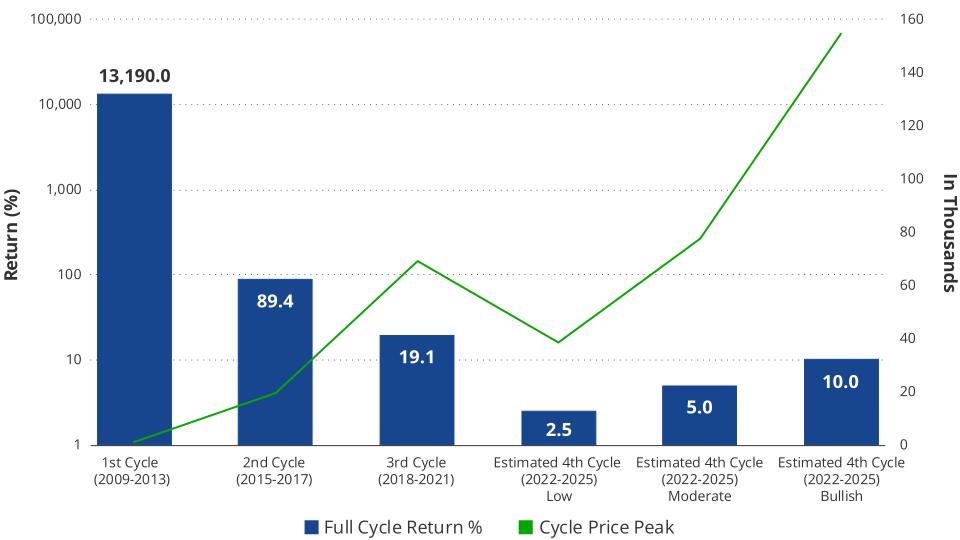
Source: VanEck Research, Data as of 30/09/2023. Historic performance is no guarantee for future results.
Explanation: Bitcoin halving is a process that occurs approximately every four years, during which the rewards for mining new blocks are halved. This mechanism is programmed into Bitcoin's code to control its inflation.
Traditionally, bull markets have started well before the actual halving event. This anticipation is driven by the belief that the reduced rewards for mining will create scarcity, potentially driving up the price.

Source: VanEck Research, Data as of 30/09/2023. Historic performance is no guarantee for future results.
Explanation: This metric refers to the proportion of cryptocurrency holders who have recently acquired their assets (short term holders) compared to those who have held their assets for an extended period (long term holders).
Currently, the market has seen a significant exodus of short term holders, leaving ample room for potential growth. Historically, the bottom of a bear market is associated with a maximum level of long term holders. As the market shifts into a bull phase, the ratio tilts in favor of short term holders. This phenomenon comes in phases, starting with long-term holder accumulation which transitions in long-term holder distribution. While long term-holders are distributing coins, short-term holders are accumulating faster than long term-holders are distributing giving rise to significant price appreciation (albeit for a shorter amount of time as the bull market may soon come to an end). Short-term holder accumulation is followed short term holder distribution faster than long-term holders can accumulate leading to significant price depreciation.

Source: VanEck Research, data as of 30/09/2023. Historic performance is not an indicator of future results.
After a crash, it's crucial to monitor the usage of a blockchain network, measured by the number of transactions conducted on the chain. Recent data indicates that the chain's activity has largely rebounded, approaching pre-crash levels. This suggests renewed interest and activity in the cryptocurrency space.
Bull markets are characterized by rapid price appreciation and a surge in trading volume. Interestingly, we are noticing a shift in this trend. While price appreciation is a key factor, the trading volume, which reflects the level of market participation, has seen notable changes. This evolving dynamic may signal the transition from a bear to a bull market.
Explanation: DApps are decentralized applications based on smart contracts that use blockchain as their main infrastructure. DApps often have their own utility token but also leverage the native network token (such as ETH) to facilitate transactions or any other on-chain activity driven by the DApp.
In the past year, increasingly many DApps have found product market fit and a long term sustainable business model that actually makes sense to decentralize. The utility token creates incentives and revenue streams for token holders and users while the DApp provides a service or product that is unique and cannot be done with traditional Web2 technology.
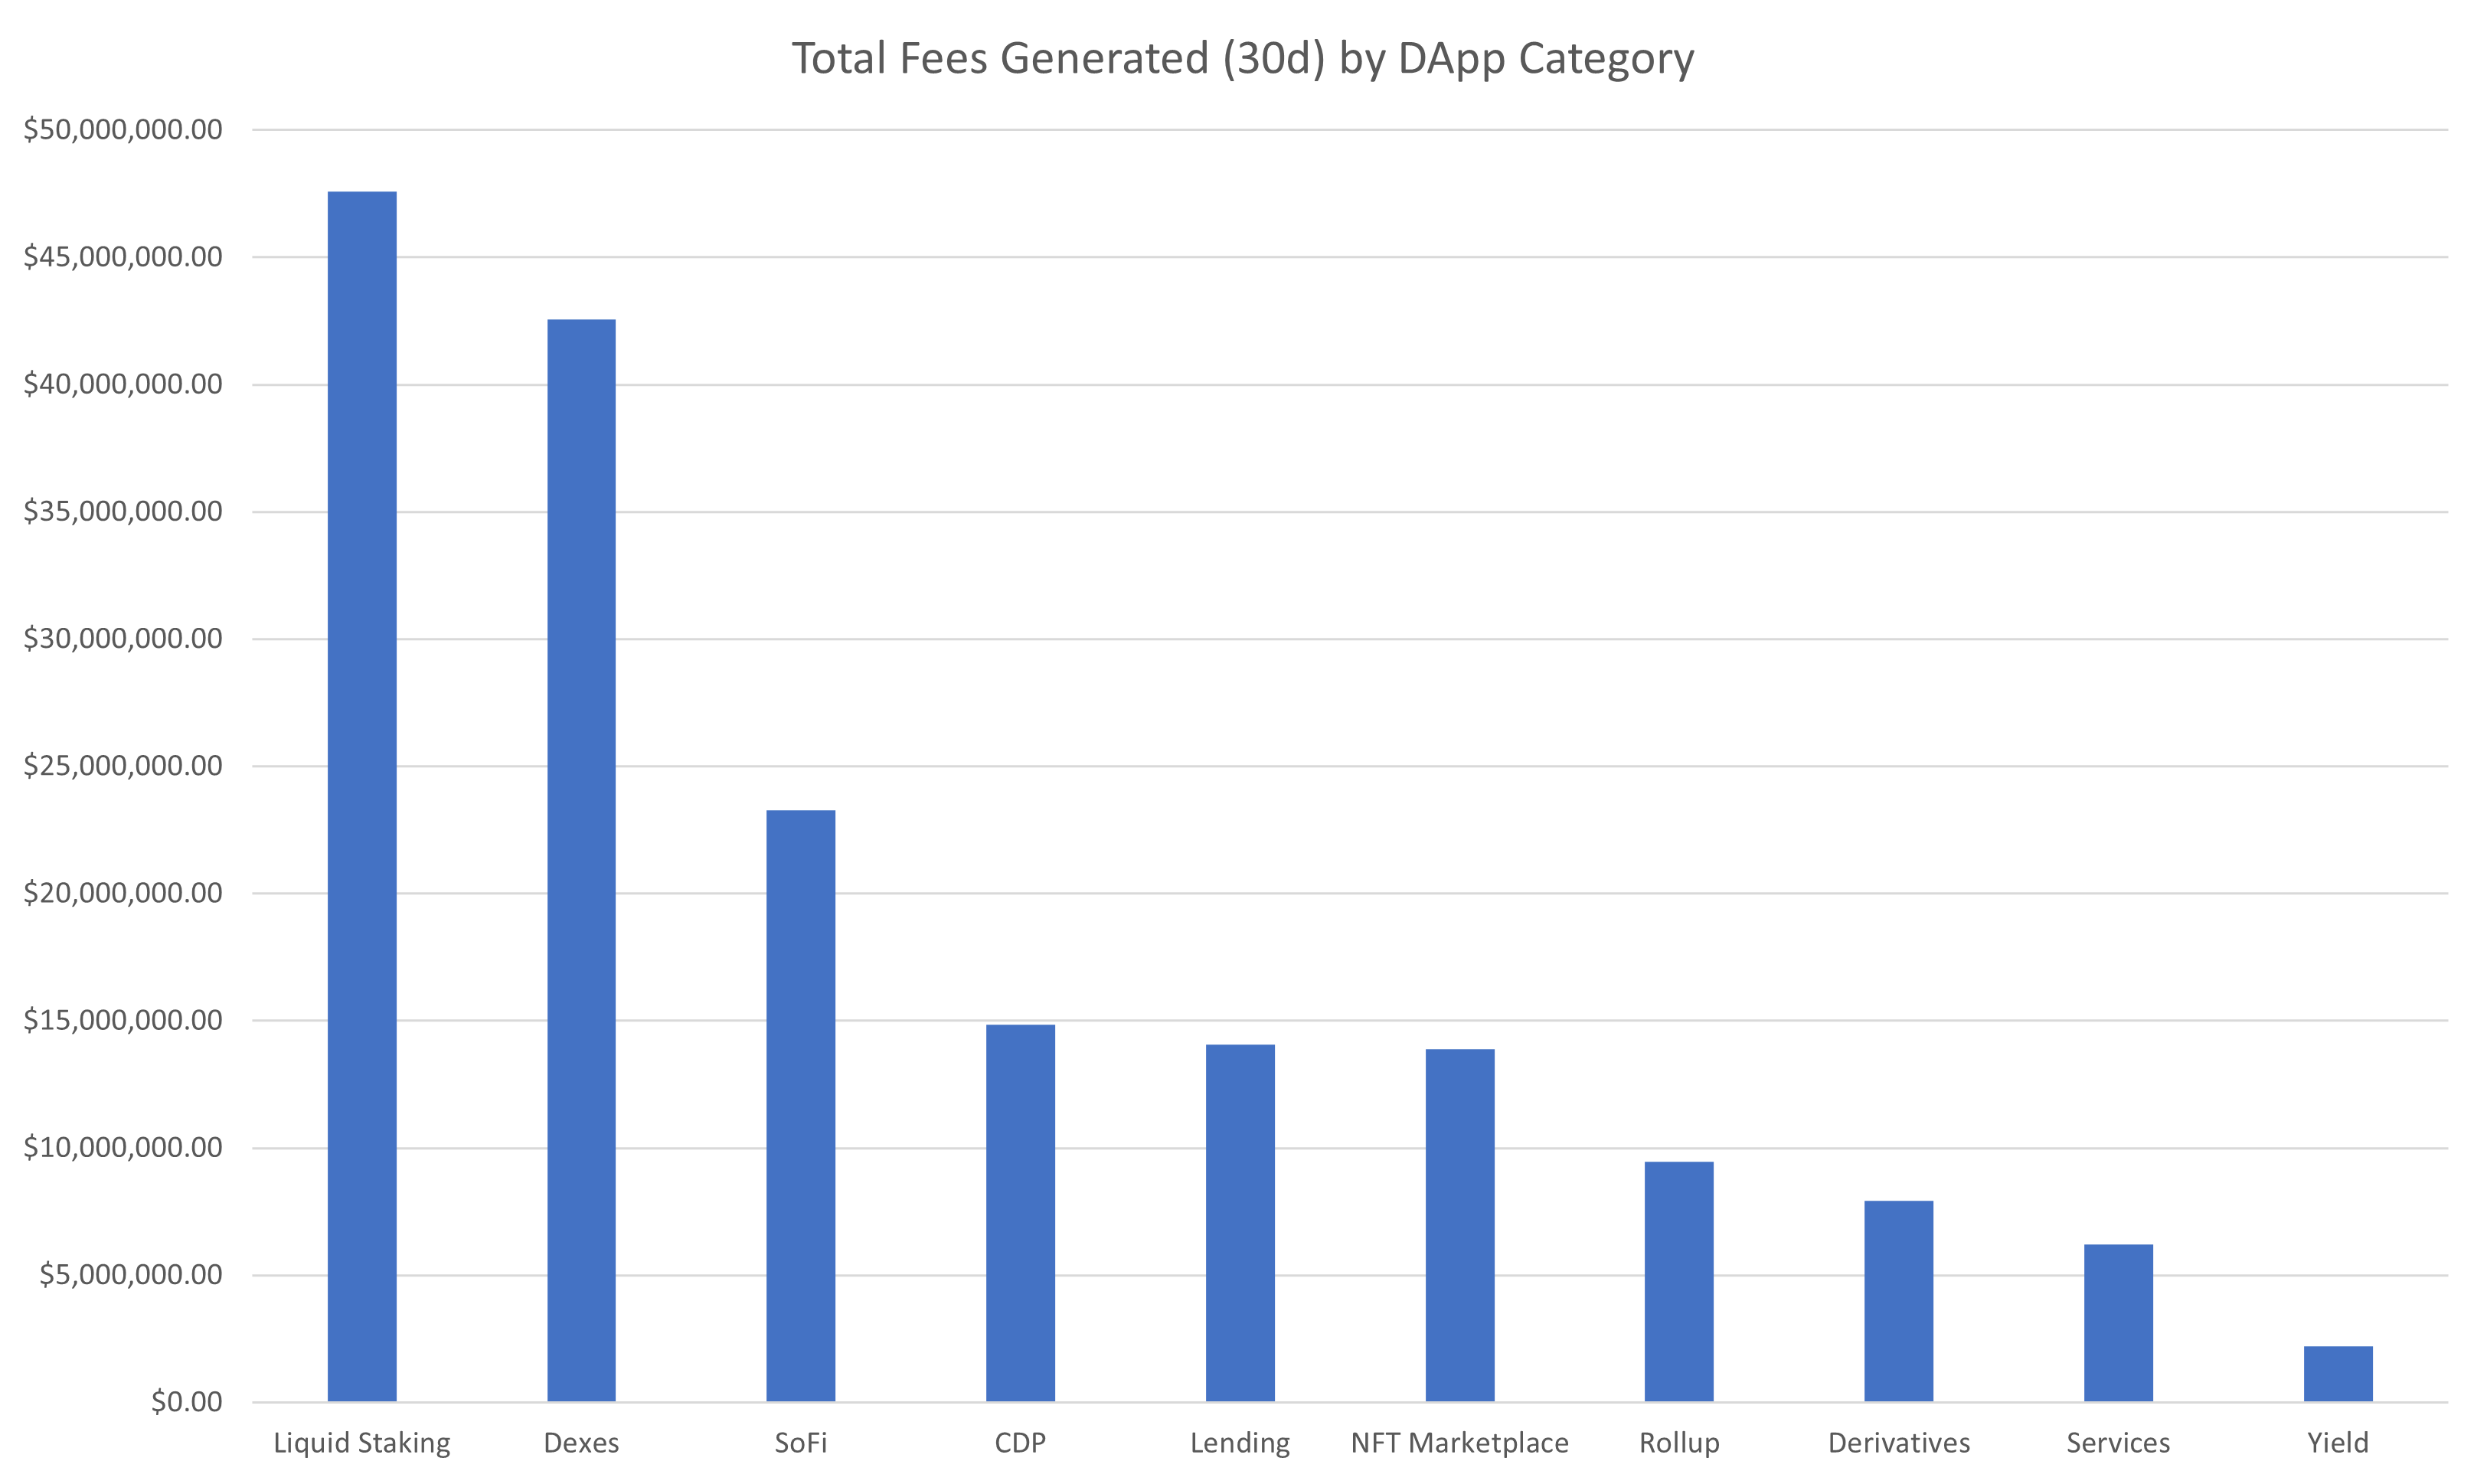
Source: VanEck Research, Data as of 30/09/2023. This should not be understood as financial advice for any particular asset type or industry.
For each of the beforementioned reasons, historical performance or events are not an indicator for future results. Investing in crypto comes with significant risks such as the risk of extreme volatility and risk of total loss.
While cryptocurrency markets are known for their volatility, there are several compelling indicators suggesting that the bear market may be on its last legs. From historical cycles to fundamental metrics like short term vs. long term holder ratios, the signs are encouraging. As always, it's important to approach investment decisions with caution and conduct thorough research.
To receive more Digital Assets insights, subscribe for our Crypto Newsletter
Important Information
This is not financial research but the opinion of the author of the article. We publish this information to inform and educate about recent market developments and technological updates, not to give any recommendation for certain products or projects. The selection of articles should therefore not be understood as financial advice or recommendation for any specific product and/or digital asset. We may occasionally include analysis of past market, network performance expectations and/or on-chain performance. Historical performance is not indicative for future returns.
For informational and advertising purposes only.
This information originates from VanEck (Europe) GmbH, Kreuznacher Straße 30, 60486 Frankfurt am Main. It is intended only to provide general and preliminary information to investors and shall not be construed as investment, legal or tax advice. VanEck (Europe) GmbH and its associated and affiliated companies (together “VanEck”) assume no liability with regards to any investment, divestment or retention decision taken by the investor on the basis of this information. Views and opinions expressed are current as of the date of this information and are subject to change with market conditions. Certain statements contained herein may constitute projections, forecasts and other forward looking statements, which do not reflect actual results. VanEck makes no representation or warranty, express or implied regarding the advisability of investing in securities or digital assets generally or in the product mentioned in this information (the “Product”) or the ability of the underlying Index to track the performance of the relevant digital assets market.
The underlying Index is the exclusive property of MarketVector Indexes GmbH, which has contracted with CryptoCompare Data Limited to maintain and calculate the Index. CryptoCompare Data Limited uses its best efforts to ensure that the Index is calculated correctly. Irrespective of its obligations towards the MarketVector Indexes GmbH, CryptoCompare Data Limited has no obligation to point out errors in the Index to third parties.
Investing is subject to risk, including the possible loss of principal up to the entire invested amount and the extreme volatility that ETNs experience. You must read the prospectus and KID before investing, in order to fully understand the potential risks and rewards associated with the decision to invest in the Product. The approved Prospectus is available at www.vaneck.com . Please note that the approval of the prospectus should not be understood as an endorsement of the Products offered or admitted to trading on a regulated market.
Performance quoted represents past performance, which is no guarantee of future results and which may be lower or higher than current performance.
Current performance may be lower or higher than average annual returns shown. Performance shows 12 month performance to the most recent Quarter end for each of the last 5yrs where available. E.g. '1st year' shows the most recent of these 12-month periods and '2nd year' shows the previous 12 month period and so on. Performance data is displayed in Base Currency terms, with net income reinvested, net of fees. Brokerage or transaction fees will apply. Investment return and the principal value of an investment will fluctuate. Notes may be worth more or less than their original cost when redeemed.
Index returns are not ETN returns and do not reflect any management fees or brokerage expenses. An index’s performance is not illustrative of the ETN’s performance. Investors cannot invest directly in the Index. Indices are not securities in which investments can be made.
No part of this material may be reproduced in any form, or referred to in any other publication, without express written permission of VanEck.
© VanEck (Europe) GmbH
This is a marketing communication. Please refer to the prospectus of the UCITS and to the KID before making any final investment decisions.
This information originates from VanEck Switzerland AG which has been appointed as distributor of VanEck products in Switzerland by the Management Company VanEck Asset Management B.V., incorporated under Dutch law and registered with the Dutch Authority for the Financial Markets (AFM). VanEck Switzerland AG’s registered address is at Genferstrasse 21, 8002 Zürich, Switzerland.
The information is intended only to provide general and preliminary information to investors and shall not be construed as investment, legal or tax advice. VanEck Switzerland AG and its associated and affiliated companies (together “VanEck”) assume no liability with regards to any investment, divestment or retention decision taken by the investor on the basis of this information. The views and opinions expressed are those of the author(s) but not necessarily those of VanEck. Opinions are current as of the publication date and are subject to change with market conditions. Certain statements contained herein may constitute projections, forecasts and other forward-looking statements, which do not reflect actual results. Information provided by third party sources is believed to be reliable and have not been independently verified for accuracy or completeness and cannot be guaranteed. Brokerage or transaction fees may apply. A copy of the latest prospectus, the Articles, the Key Information Document, the annual report and semi-annual report can be found on our website www.vaneck.com or can be obtained free of charge from the representative in Switzerland: First Independent Fund Services Ltd, Feldeggstrasse 12, 8008 Zurich, Switzerland. Swiss paying agent: Helvetische Bank AG, Seefeldstrasse 215, CH-8008 Zürich.
All performance information is based on historical data and does not predict future returns. Investing is subject to risk, including the possible loss of principal.
No part of this material may be reproduced in any form, or referred to in any other publication, without express written permission of VanEck.
© VanEck Switzerland AG

09 March 2026
09 March 2026