VanEck Monthly Bitcoin ChainCheck
26 February 2024
Welcome to the first version of the VanEck Monthly Bitcoin ChainCheck where we present on-chain indicators for investors to directly assess Bitcoin blockchain's health and adoption.
Please note that VanEck has exposure to bitcoin.
Welcome to the first version of the VanEck Monthly Bitcoin ChainCheck where we present on-chain indicators for investors to directly assess Bitcoin blockchain's health and adoption.
Some takeaways for January 2024:
Bitcoin’s Price Action
- Market sentiment: Bitcoin dominance stayed flattish at 51% as BTC’s 30-day average price fell 3% in January.
- Regional trading: US traders stayed more bullish than EU and Asia participants, as the price of BTC rose during US trading hours but was negative in EU and Asia trading. This dynamic represents a continuation of a long-standing trend in which Bitcoin is generally mined and sold in Asia and purchased during US hours.
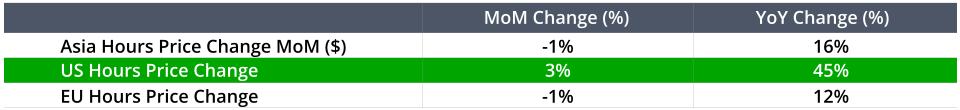
Source: Glassnode, as of 2/2/24. Past performance is no guarantee of future results.
- Funding rates: Bitcoin futures annualized basis (funding costs) fell sharply to 11% as traders lost their appetite for leverage after the Bitcoin ETFs launched.
Bitcoin’s Network Activity, Adoption, and Fees
- Daily transactions: Daily transactions are down 18% in the last 30 days, but the overall adoption and network activity remain extremely strong, in the 97th percentile of all-time.
- Ordinal inscriptions: Daily inscriptions (aka ordinals) activity fell 34% in the last month.
- Total transfer volume: However, total transfer volume has increased by 10% in the last 30 days, reaching $39.6 billion. This divergence may reflect larger institutional participation in the wake of the spot ETF launches.
- Average transaction fees: Average transaction fees both in USD and BTC, have experienced a significant 70% decrease in the last 30 days as inscription activity has cooled.
Bitcoin Market Health and Profitability
- Percent of addresses in profit: 85% of Bitcoin addresses are currently in profit, although there has been a slight 5% decrease in the last month. Such levels are not typically associated with a very frothy market.
- Net unrealized profit/loss: Likewise, a net unrealized profit/loss ratio (NUPL) of 0.48 suggests that network participants are optimistic about the future but not euphoric.
Bitcoin Miners
Total daily BTC miner revenues: fell by 19%, with heavy competition for hash rate ahead of the Bitcoin halving. Miners’ BTC transfers to exchanges fell somewhat from December’s very high levels but still remain high (87% percentile) vs. history as miner balance sheets must be fortified ahead of the halving. Crypto equities’ market cap fell 14% m/m vs. the avg BTC price -3%.
Chart of the Month: January BTC Transfer Volume Rises Despite 3% Drop in Average Price
Total Transfer Volume (USD)
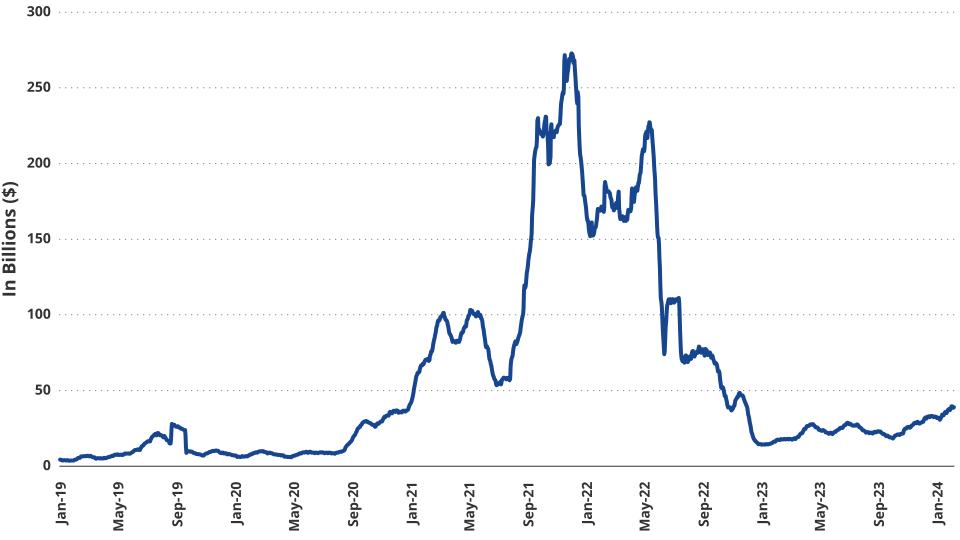
Source: Glassnode as of 1/31/24. Past performance is no guarantee of future results.
Bitcoin ChainCheck Monthly Dashboard
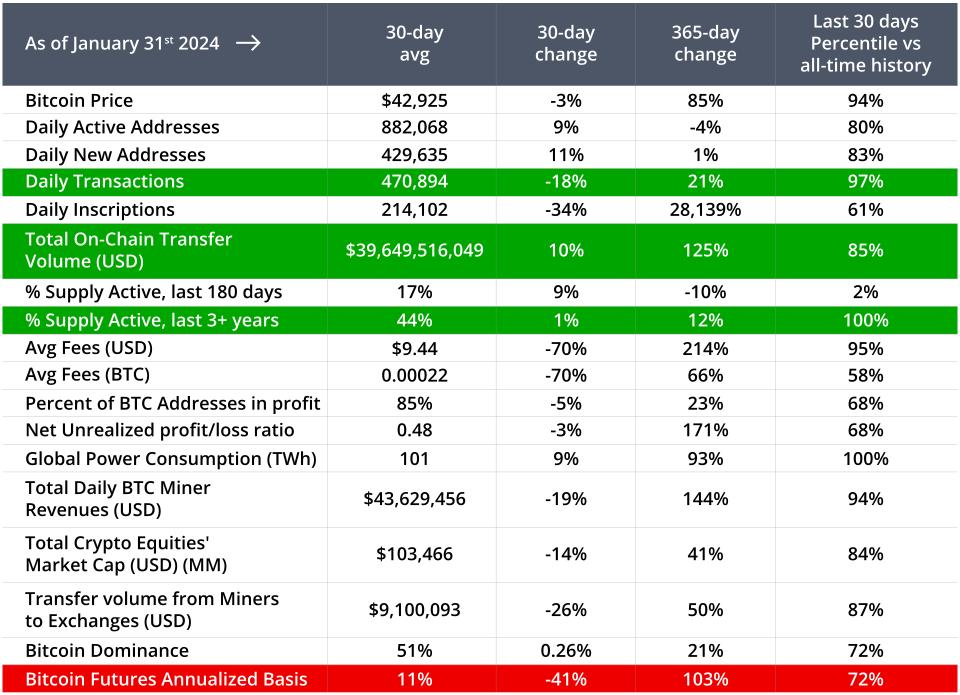
Source: Glassnode, VanEck research as of 2/2/24. Past performance is no guarantee of future results.
Notes:
Net unrealized profit/loss ratio (NUPL) can be calculated by subtracting the realized market cap from the market cap and dividing the result by the market cap. When a high percentage of Bitcoin’s market cap consists of unrealized profits, it can be interpreted that investors are greedy. Background reading here.
Links to third party websites are provided as a convenience and the inclusion of such links does not imply any endorsement, approval, investigation, verification or monitoring by us of any content or information contained within or accessible from the linked sites. By clicking on the link to a non-VanEck webpage, you acknowledge that you are entering a third-party website subject to its own terms and conditions. VanEck disclaims responsibility for content, legality of access or suitability of the third-party websites.
Important Information
This is not financial research but the opinion of the author of the article. We publish this information to inform and educate about recent market developments and technological updates, not to give any recommendation for certain products or projects. The selection of articles should therefore not be understood as financial advice or recommendation for any specific product and/or digital asset. We may occasionally include analysis of past market, network performance expectations and/or on-chain performance. Historical performance is not indicative for future returns.
For informational and advertising purposes only.
This information originates from VanEck (Europe) GmbH, Kreuznacher Straße 30, 60486 Frankfurt am Main. It is intended only to provide general and preliminary information to investors and shall not be construed as investment, legal or tax advice. VanEck (Europe) GmbH and its associated and affiliated companies (together “VanEck”) assume no liability with regards to any investment, divestment or retention decision taken by the investor on the basis of this information. Views and opinions expressed are current as of the date of this information and are subject to change with market conditions. Certain statements contained herein may constitute projections, forecasts and other forward looking statements, which do not reflect actual results. VanEck makes no representation or warranty, express or implied regarding the advisability of investing in securities or digital assets generally or in the product mentioned in this information (the “Product”) or the ability of the underlying Index to track the performance of the relevant digital assets market.
The underlying Index is the exclusive property of MarketVector Indexes GmbH, which has contracted with CryptoCompare Data Limited to maintain and calculate the Index. CryptoCompare Data Limited uses its best efforts to ensure that the Index is calculated correctly. Irrespective of its obligations towards the MarketVector Indexes GmbH, CryptoCompare Data Limited has no obligation to point out errors in the Index to third parties.
Investing is subject to risk, including the possible loss of principal up to the entire invested amount and the extreme volatility that ETNs experience. You must read the prospectus and KID before investing, in order to fully understand the potential risks and rewards associated with the decision to invest in the Product. The approved Prospectus is available at www.vaneck.com . Please note that the approval of the prospectus should not be understood as an endorsement of the Products offered or admitted to trading on a regulated market.
Performance quoted represents past performance, which is no guarantee of future results and which may be lower or higher than current performance.
Current performance may be lower or higher than average annual returns shown. Performance shows 12 month performance to the most recent Quarter end for each of the last 5yrs where available. E.g. '1st year' shows the most recent of these 12-month periods and '2nd year' shows the previous 12 month period and so on. Performance data is displayed in Base Currency terms, with net income reinvested, net of fees. Brokerage or transaction fees will apply. Investment return and the principal value of an investment will fluctuate. Notes may be worth more or less than their original cost when redeemed.
Index returns are not ETN returns and do not reflect any management fees or brokerage expenses. An index’s performance is not illustrative of the ETN’s performance. Investors cannot invest directly in the Index. Indices are not securities in which investments can be made.
No part of this material may be reproduced in any form, or referred to in any other publication, without express written permission of VanEck.
© VanEck (Europe) GmbH
Important Disclosure
This is a marketing communication. Please refer to the prospectus of the UCITS and to the KID before making any final investment decisions.
This information originates from VanEck (Europe) GmbH, which has been appointed as distributor of VanEck products in Europe by the Management Company VanEck Asset Management B.V., incorporated under Dutch law and registered with the Dutch Authority for the Financial Markets (AFM). VanEck (Europe) GmbH with registered address at Kreuznacher Str. 30, 60486 Frankfurt, Germany, is a financial services provider regulated by the Federal Financial Supervisory Authority in Germany (BaFin).
The information is intended only to provide general and preliminary information to investors and shall not be construed as investment, legal or tax advice VanEck (Europe) GmbH, VanEck Switzerland AG, VanEck Securities UK Limited and their associated and affiliated companies (together “VanEck”) assume no liability with regards to any investment, divestment or retention decision taken by the investor on the basis of this information. The views and opinions expressed are those of the author(s) but not necessarily those of VanEck. Opinions are current as of the publication date and are subject to change with market conditions. Certain statements contained herein may constitute projections, forecasts and other forward-looking statements, which do not reflect actual results. Information provided by third party sources is believed to be reliable and have not been independently verified for accuracy or completeness and cannot be guaranteed. Brokerage or transaction fees may apply.
All performance information is based on historical data and does not predict future returns. Investing is subject to risk, including the possible loss of principal.
No part of this material may be reproduced in any form, or referred to in any other publication, without express written permission of VanEck.
© VanEck (Europe) GmbH / VanEck Asset Management B.V.